透明、花式的图形
有时您在绘制数据之前就知道数据的样子,并且可能知道例如右上角没有太多数据。然后,您可以安全地创建不覆盖数据的图例:
ax.legend(loc='upper right')
其他时候你不知道你的数据在哪里,默认的loc =’best’会尝试放置图例:
ax.legend()
但是,您的图例可能会与您的数据重叠,在这些情况下,使图例框架透明是很好的。
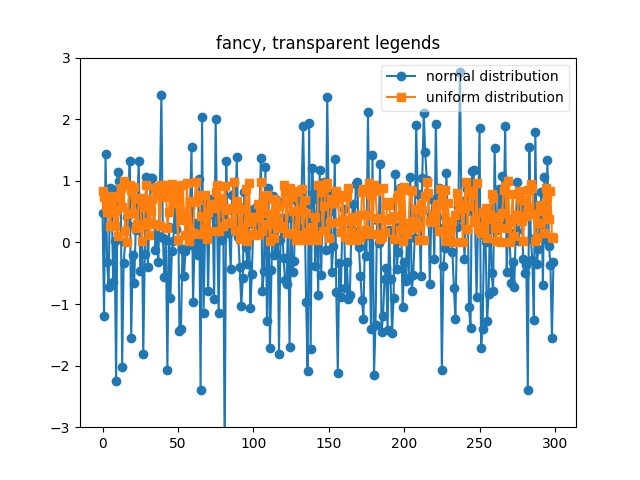
import matplotlib.pyplot as pltimport numpy as npnp.random.seed(1234)fig, ax = plt.subplots(1)ax.plot(np.random.randn(300), 'o-', label='normal distribution')ax.plot(np.random.rand(300), 's-', label='uniform distribution')ax.set_ylim(-3, 3)ax.legend(fancybox=True, framealpha=0.5)ax.set_title('fancy, transparent legends')plt.show()
下载这个示例

若有收获,就点个赞吧
0 人点赞
