演示日期转换
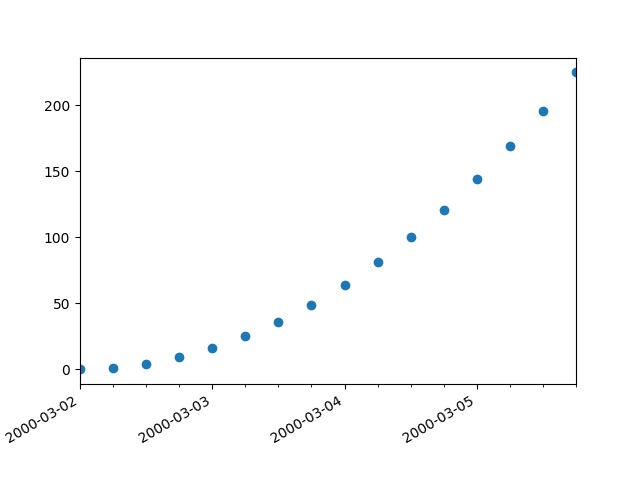
import datetimeimport matplotlib.pyplot as pltfrom matplotlib.dates import DayLocator, HourLocator, DateFormatter, drangeimport numpy as npdate1 = datetime.datetime(2000, 3, 2)date2 = datetime.datetime(2000, 3, 6)delta = datetime.timedelta(hours=6)dates = drange(date1, date2, delta)y = np.arange(len(dates))fig, ax = plt.subplots()ax.plot_date(dates, y ** 2)# this is superfluous, since the autoscaler should get it right, but# use date2num and num2date to convert between dates and floats if# you want; both date2num and num2date convert an instance or sequenceax.set_xlim(dates[0], dates[-1])# The hour locator takes the hour or sequence of hours you want to# tick, not the base multipleax.xaxis.set_major_locator(DayLocator())ax.xaxis.set_minor_locator(HourLocator(range(0, 25, 6)))ax.xaxis.set_major_formatter(DateFormatter('%Y-%m-%d'))ax.fmt_xdata = DateFormatter('%Y-%m-%d %H:%M:%S')fig.autofmt_xdate()plt.show()
下载这个示例

若有收获,就点个赞吧
0 人点赞
