同一轴上的不同比例
演示如何在左右y轴上显示两个刻度。
此示例使用华氏度和摄氏度量表。
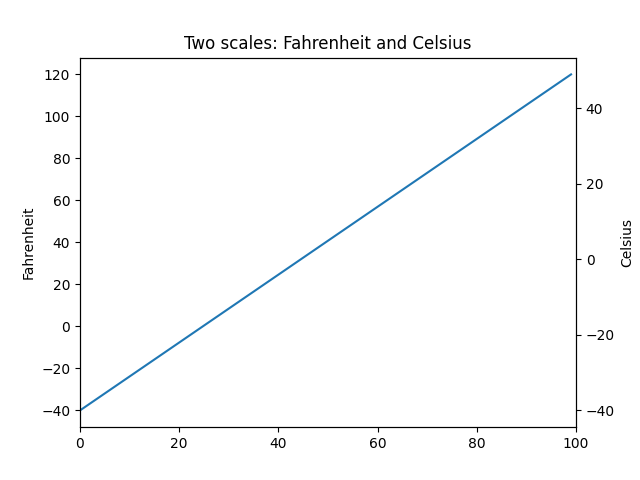
import matplotlib.pyplot as pltimport numpy as npdef fahrenheit2celsius(temp):"""Returns temperature in Celsius."""return (5. / 9.) * (temp - 32)def convert_ax_c_to_celsius(ax_f):"""Update second axis according with first axis."""y1, y2 = ax_f.get_ylim()ax_c.set_ylim(fahrenheit2celsius(y1), fahrenheit2celsius(y2))ax_c.figure.canvas.draw()fig, ax_f = plt.subplots()ax_c = ax_f.twinx()# automatically update ylim of ax2 when ylim of ax1 changes.ax_f.callbacks.connect("ylim_changed", convert_ax_c_to_celsius)ax_f.plot(np.linspace(-40, 120, 100))ax_f.set_xlim(0, 100)ax_f.set_title('Two scales: Fahrenheit and Celsius')ax_f.set_ylabel('Fahrenheit')ax_c.set_ylabel('Celsius')plt.show()
下载这个示例

若有收获,就点个赞吧
0 人点赞
