直方图(hist)函数的几个特性演示
除基本直方图外,此演示还显示了一些可选功能:
- 设置数据箱的数量。
标准化标志,用于标准化箱高度,使直方图的积分为1.得到的直方图是概率密度函数的近似值。- 设置条形的面部颜色。
- 设置不透明度(alpha值)。
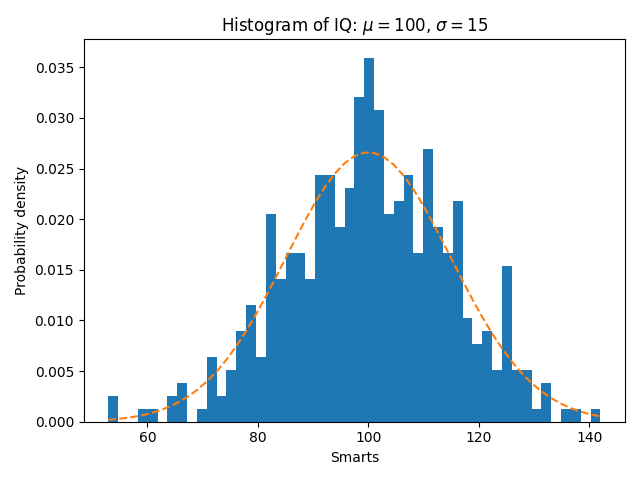
选择不同的存储量和大小会显著影响直方图的形状。Astropy文档有很多关于如何选择这些参数的部分。
import matplotlibimport numpy as npimport matplotlib.pyplot as pltnp.random.seed(19680801)# example datamu = 100 # mean of distributionsigma = 15 # standard deviation of distributionx = mu + sigma * np.random.randn(437)num_bins = 50fig, ax = plt.subplots()# the histogram of the datan, bins, patches = ax.hist(x, num_bins, density=1)# add a 'best fit' liney = ((1 / (np.sqrt(2 * np.pi) * sigma)) *np.exp(-0.5 * (1 / sigma * (bins - mu))**2))ax.plot(bins, y, '--')ax.set_xlabel('Smarts')ax.set_ylabel('Probability density')ax.set_title(r'Histogram of IQ: $\mu=100$, $\sigma=15$')# Tweak spacing to prevent clipping of ylabelfig.tight_layout()plt.show()
参考
此示例显示了以下函数和方法的使用:
matplotlib.axes.Axes.histmatplotlib.axes.Axes.set_titlematplotlib.axes.Axes.set_xlabelmatplotlib.axes.Axes.set_ylabel
下载这个示例

若有收获,就点个赞吧
0 人点赞
