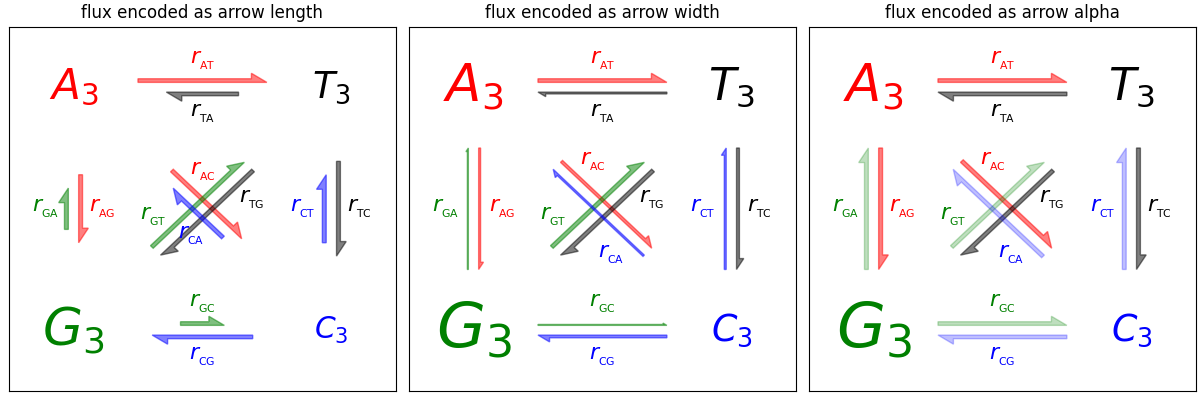
箭头符号演示
新的花式箭头工具的箭头绘制示例。
代码由此人贡献: Rob Knight < rob@spot.colorado.edu >
用法:
import matplotlib.pyplot as pltimport numpy as nprates_to_bases = {'r1': 'AT', 'r2': 'TA', 'r3': 'GA', 'r4': 'AG', 'r5': 'CA','r6': 'AC', 'r7': 'GT', 'r8': 'TG', 'r9': 'CT', 'r10': 'TC','r11': 'GC', 'r12': 'CG'}numbered_bases_to_rates = {v: k for k, v in rates_to_bases.items()}lettered_bases_to_rates = {v: 'r' + v for k, v in rates_to_bases.items()}def add_dicts(d1, d2):"""Adds two dicts and returns the result."""result = d1.copy()result.update(d2)return resultdef make_arrow_plot(data, size=4, display='length', shape='right',max_arrow_width=0.03, arrow_sep=0.02, alpha=0.5,normalize_data=False, ec=None, labelcolor=None,head_starts_at_zero=True,rate_labels=lettered_bases_to_rates,**kwargs):"""Makes an arrow plot.Parameters:data: dict with probabilities for the bases and pair transitions.size: size of the graph in inches.display: 'length', 'width', or 'alpha' for arrow property to change.shape: 'full', 'left', or 'right' for full or half arrows.max_arrow_width: maximum width of an arrow, data coordinates.arrow_sep: separation between arrows in a pair, data coordinates.alpha: maximum opacity of arrows, default 0.8.**kwargs can be anything allowed by a Arrow object, e.g.linewidth and edgecolor."""plt.xlim(-0.5, 1.5)plt.ylim(-0.5, 1.5)plt.gcf().set_size_inches(size, size)plt.xticks([])plt.yticks([])max_text_size = size * 12min_text_size = sizelabel_text_size = size * 2.5text_params = {'ha': 'center', 'va': 'center', 'family': 'sans-serif','fontweight': 'bold'}r2 = np.sqrt(2)deltas = {'AT': (1, 0),'TA': (-1, 0),'GA': (0, 1),'AG': (0, -1),'CA': (-1 / r2, 1 / r2),'AC': (1 / r2, -1 / r2),'GT': (1 / r2, 1 / r2),'TG': (-1 / r2, -1 / r2),'CT': (0, 1),'TC': (0, -1),'GC': (1, 0),'CG': (-1, 0)}colors = {'AT': 'r','TA': 'k','GA': 'g','AG': 'r','CA': 'b','AC': 'r','GT': 'g','TG': 'k','CT': 'b','TC': 'k','GC': 'g','CG': 'b'}label_positions = {'AT': 'center','TA': 'center','GA': 'center','AG': 'center','CA': 'left','AC': 'left','GT': 'left','TG': 'left','CT': 'center','TC': 'center','GC': 'center','CG': 'center'}def do_fontsize(k):return float(np.clip(max_text_size * np.sqrt(data[k]),min_text_size, max_text_size))A = plt.text(0, 1, '$A_3$', color='r', size=do_fontsize('A'),**text_params)T = plt.text(1, 1, '$T_3$', color='k', size=do_fontsize('T'),**text_params)G = plt.text(0, 0, '$G_3$', color='g', size=do_fontsize('G'),**text_params)C = plt.text(1, 0, '$C_3$', color='b', size=do_fontsize('C'),**text_params)arrow_h_offset = 0.25 # data coordinates, empirically determinedmax_arrow_length = 1 - 2 * arrow_h_offsetmax_head_width = 2.5 * max_arrow_widthmax_head_length = 2 * max_arrow_widtharrow_params = {'length_includes_head': True, 'shape': shape,'head_starts_at_zero': head_starts_at_zero}ax = plt.gca()sf = 0.6 # max arrow size represents this in data coordsd = (r2 / 2 + arrow_h_offset - 0.5) / r2 # distance for diagsr2v = arrow_sep / r2 # offset for diags# tuple of x, y for start positionpositions = {'AT': (arrow_h_offset, 1 + arrow_sep),'TA': (1 - arrow_h_offset, 1 - arrow_sep),'GA': (-arrow_sep, arrow_h_offset),'AG': (arrow_sep, 1 - arrow_h_offset),'CA': (1 - d - r2v, d - r2v),'AC': (d + r2v, 1 - d + r2v),'GT': (d - r2v, d + r2v),'TG': (1 - d + r2v, 1 - d - r2v),'CT': (1 - arrow_sep, arrow_h_offset),'TC': (1 + arrow_sep, 1 - arrow_h_offset),'GC': (arrow_h_offset, arrow_sep),'CG': (1 - arrow_h_offset, -arrow_sep)}if normalize_data:# find maximum value for rates, i.e. where keys are 2 chars longmax_val = 0for k, v in data.items():if len(k) == 2:max_val = max(max_val, v)# divide rates by max val, multiply by arrow scale factorfor k, v in data.items():data[k] = v / max_val * sfdef draw_arrow(pair, alpha=alpha, ec=ec, labelcolor=labelcolor):# set the length of the arrowif display == 'length':length = max_head_length + data[pair] / sf * (max_arrow_length -max_head_length)else:length = max_arrow_length# set the transparency of the arrowif display == 'alpha':alpha = min(data[pair] / sf, alpha)# set the width of the arrowif display == 'width':scale = data[pair] / sfwidth = max_arrow_width * scalehead_width = max_head_width * scalehead_length = max_head_length * scaleelse:width = max_arrow_widthhead_width = max_head_widthhead_length = max_head_lengthfc = colors[pair]ec = ec or fcx_scale, y_scale = deltas[pair]x_pos, y_pos = positions[pair]plt.arrow(x_pos, y_pos, x_scale * length, y_scale * length,fc=fc, ec=ec, alpha=alpha, width=width,head_width=head_width, head_length=head_length,**arrow_params)# figure out coordinates for text# if drawing relative to base: x and y are same as for arrow# dx and dy are one arrow width left and up# need to rotate based on direction of arrow, use x_scale and y_scale# as sin x and cos x?sx, cx = y_scale, x_scalewhere = label_positions[pair]if where == 'left':orig_position = 3 * np.array([[max_arrow_width, max_arrow_width]])elif where == 'absolute':orig_position = np.array([[max_arrow_length / 2.0,3 * max_arrow_width]])elif where == 'right':orig_position = np.array([[length - 3 * max_arrow_width,3 * max_arrow_width]])elif where == 'center':orig_position = np.array([[length / 2.0, 3 * max_arrow_width]])else:raise ValueError("Got unknown position parameter %s" % where)M = np.array([[cx, sx], [-sx, cx]])coords = np.dot(orig_position, M) + [[x_pos, y_pos]]x, y = np.ravel(coords)orig_label = rate_labels[pair]label = r'$%s_{_{\mathrm{%s}}}$' % (orig_label[0], orig_label[1:])plt.text(x, y, label, size=label_text_size, ha='center', va='center',color=labelcolor or fc)for p in sorted(positions):draw_arrow(p)# test dataall_on_max = dict([(i, 1) for i in 'TCAG'] +[(i + j, 0.6) for i in 'TCAG' for j in 'TCAG'])realistic_data = {'A': 0.4,'T': 0.3,'G': 0.5,'C': 0.2,'AT': 0.4,'AC': 0.3,'AG': 0.2,'TA': 0.2,'TC': 0.3,'TG': 0.4,'CT': 0.2,'CG': 0.3,'CA': 0.2,'GA': 0.1,'GT': 0.4,'GC': 0.1}extreme_data = {'A': 0.75,'T': 0.10,'G': 0.10,'C': 0.05,'AT': 0.6,'AC': 0.3,'AG': 0.1,'TA': 0.02,'TC': 0.3,'TG': 0.01,'CT': 0.2,'CG': 0.5,'CA': 0.2,'GA': 0.1,'GT': 0.4,'GC': 0.2}sample_data = {'A': 0.2137,'T': 0.3541,'G': 0.1946,'C': 0.2376,'AT': 0.0228,'AC': 0.0684,'AG': 0.2056,'TA': 0.0315,'TC': 0.0629,'TG': 0.0315,'CT': 0.1355,'CG': 0.0401,'CA': 0.0703,'GA': 0.1824,'GT': 0.0387,'GC': 0.1106}if __name__ == '__main__':from sys import argvd = Noneif len(argv) > 1:if argv[1] == 'full':d = all_on_maxscaled = Falseelif argv[1] == 'extreme':d = extreme_datascaled = Falseelif argv[1] == 'realistic':d = realistic_datascaled = Falseelif argv[1] == 'sample':d = sample_datascaled = Trueif d is None:d = all_on_maxscaled = Falseif len(argv) > 2:display = argv[2]else:display = 'length'size = 4plt.figure(figsize=(size, size))make_arrow_plot(d, display=display, linewidth=0.001, edgecolor=None,normalize_data=scaled, head_starts_at_zero=True, size=size)plt.show()
下载这个示例

若有收获,就点个赞吧
0 人点赞
