单位条形图
使用各种厘米和英寸转换的图像。此示例显示默认单位内省如何工作(ax1),如何使用各种关键字来设置x和y单位以覆盖默认值(ax2,ax3,ax4)以及如何使用标量设置xlimits(ax3,当前单位) 假设)或单位(用于将数字转换为当前单位的转换)。
此示例需要 basic_units.py
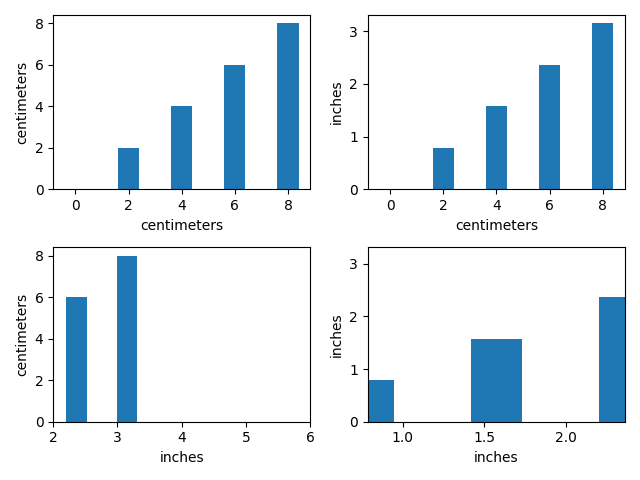
import numpy as npfrom basic_units import cm, inchimport matplotlib.pyplot as pltcms = cm * np.arange(0, 10, 2)bottom = 0 * cmwidth = 0.8 * cmfig, axs = plt.subplots(2, 2)axs[0, 0].bar(cms, cms, bottom=bottom)axs[0, 1].bar(cms, cms, bottom=bottom, width=width, xunits=cm, yunits=inch)axs[1, 0].bar(cms, cms, bottom=bottom, width=width, xunits=inch, yunits=cm)axs[1, 0].set_xlim(2, 6) # scalars are interpreted in current unitsaxs[1, 1].bar(cms, cms, bottom=bottom, width=width, xunits=inch, yunits=inch)axs[1, 1].set_xlim(2 * cm, 6 * cm) # cm are converted to inchesfig.tight_layout()plt.show()
下载这个示例

若有收获,就点个赞吧
0 人点赞
