演示轴 Hbox Divider
HBox Divider用于排列子图。
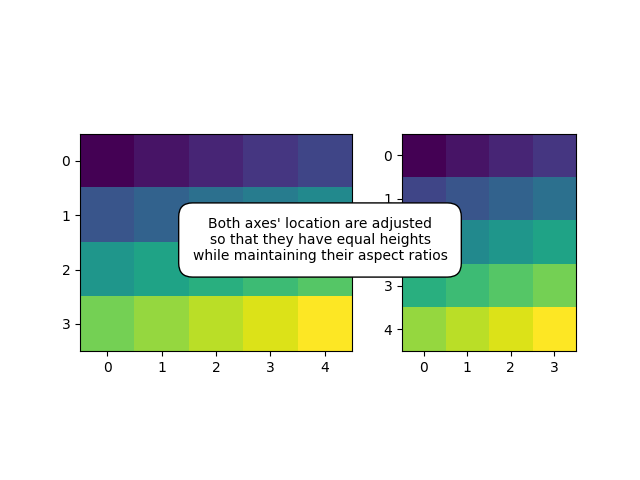
import numpy as npimport matplotlib.pyplot as pltfrom mpl_toolkits.axes_grid1.axes_divider import HBoxDividerimport mpl_toolkits.axes_grid1.axes_size as Sizedef make_heights_equal(fig, rect, ax1, ax2, pad):# pad in inchesh1, v1 = Size.AxesX(ax1), Size.AxesY(ax1)h2, v2 = Size.AxesX(ax2), Size.AxesY(ax2)pad_v = Size.Scaled(1)pad_h = Size.Fixed(pad)my_divider = HBoxDivider(fig, rect,horizontal=[h1, pad_h, h2],vertical=[v1, pad_v, v2])ax1.set_axes_locator(my_divider.new_locator(0))ax2.set_axes_locator(my_divider.new_locator(2))if __name__ == "__main__":arr1 = np.arange(20).reshape((4, 5))arr2 = np.arange(20).reshape((5, 4))fig, (ax1, ax2) = plt.subplots(1, 2)ax1.imshow(arr1, interpolation="nearest")ax2.imshow(arr2, interpolation="nearest")rect = 111 # subplot param for combined axesmake_heights_equal(fig, rect, ax1, ax2, pad=0.5) # pad in inchesfor ax in [ax1, ax2]:ax.locator_params(nbins=4)# annotateax3 = plt.axes([0.5, 0.5, 0.001, 0.001], frameon=False)ax3.xaxis.set_visible(False)ax3.yaxis.set_visible(False)ax3.annotate("Location of two axes are adjusted\n""so that they have equal heights\n""while maintaining their aspect ratios", (0.5, 0.5),xycoords="axes fraction", va="center", ha="center",bbox=dict(boxstyle="round, pad=1", fc="w"))plt.show()
下载这个示例

若有收获,就点个赞吧
0 人点赞
