在 HTML5 画布教程的这一部分中,我们创建一些基本的和更高级的几何形状。
长方形
第一个程序绘制两个矩形。
rectangles.html
<!DOCTYPE html><html><head><title>HTML5 canvas rectangles</title><script>function draw() {var canvas = document.getElementById('myCanvas');var ctx = canvas.getContext('2d');ctx.fillStyle = 'gray';ctx.fillRect(10, 10, 60, 60);ctx.fillRect(100, 10, 100, 60);}</script></head><body onload="draw();"><canvas id="myCanvas" width="350" height="250"></canvas></body></html>
该示例使用drawRect()方法绘制矩形。
ctx.fillStyle = 'gray';
矩形的内部被涂成灰色。
ctx.fillRect(10, 10, 60, 60);ctx.fillRect(100, 10, 100, 60);
fillRect()方法用于绘制正方形和矩形。 前两个参数是要绘制的形状的 x 和 y 坐标。 最后两个参数是形状的宽度和高度。
图:矩形
基本形状
在下面的程序中,我们绘制一些基本形状。
shapes.html
<!DOCTYPE html><html><head><title>HTML5 canvas shapes</title><script>function draw() {var canvas = document.getElementById('myCanvas');var ctx = canvas.getContext('2d');ctx.fillStyle = 'gray';ctx.fillRect(10, 10, 60, 60);ctx.fillRect(100, 10, 90, 60);ctx.beginPath();ctx.arc(250, 40, 32, 0, 2*Math.PI);ctx.fill();ctx.beginPath();ctx.moveTo(10, 160);ctx.lineTo(90, 160);ctx.lineTo(50, 110);ctx.closePath();ctx.fill();ctx.save();ctx.scale(2, 1);ctx.beginPath();ctx.arc(72, 130, 25, 0, 2*Math.PI);ctx.fill();ctx.restore();ctx.beginPath();ctx.arc(250, 120, 40, 0, Math.PI);ctx.fill();}</script></head><body onload="draw();"><canvas id="myCanvas" width="350" height="350"></canvas></body></html>
画布上绘制了六个不同的形状。
ctx.fillStyle = 'gray';
形状将被涂成灰色。
ctx.fillRect(10, 10, 60, 60);ctx.fillRect(100, 10, 90, 60);
使用fillRect()方法绘制矩形。 矩形是唯一未通过beginPath()方法启动的形状。
ctx.beginPath();ctx.arc(250, 40, 32, 0, 2*Math.PI);ctx.fill();
用arc()方法绘制一个圆。 该方法将弧添加到创建的路径。 前两个参数定义圆弧中心点的 x 和 y 坐标。 接下来的两个参数指定圆弧的起点和终点。 角度以弧度定义。 最后一个参数是可选的; 它指定绘制圆弧的方向。 默认方向为顺时针。
ctx.beginPath();ctx.moveTo(10, 160);ctx.lineTo(90, 160);ctx.lineTo(50, 110);ctx.closePath();ctx.fill();
使用moveTo()和lineTo()方法,我们绘制了一个三角形。 closePath()方法使笔移回当前子路径的起点。 在我们的例子中,它完成了三角形的形状。
ctx.save();ctx.scale(2, 1);ctx.beginPath();ctx.arc(72, 130, 25, 0, 2*Math.PI);ctx.fill();ctx.restore();
通过缩放圆形来绘制椭圆形。 这些操作位于save()和restore()方法之间,因此缩放操作不会影响后续图形。
ctx.beginPath();ctx.arc(250, 120, 40, 0, Math.PI);ctx.fill();
最后的形状(半圆)用arc()方法绘制。
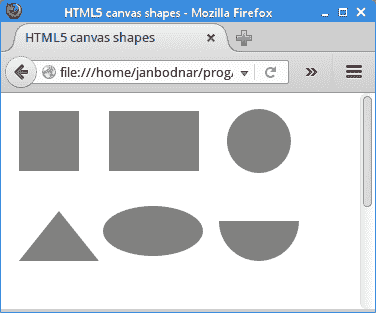
图:基本形状
饼形图
饼图是圆形图,将其分成多个切片以说明数值比例。
piechart.html
<!DOCTYPE html><html><head><title>HTML5 canvas pie chart</title><style>canvas {background: #bbb}</style><script>function draw() {var canvas = document.getElementById('myCanvas');var ctx = canvas.getContext('2d');var beginAngle = 0;var endAngle = 0;var data = [170, 60, 45];var total = 0;var colours = ["#95B524", "#AFCC4C", "#C1DD54"];const SPACE = 10;for (var i = 0; i < data.length; i++) {total += data[i];}ctx.strokeStyle = 'white';ctx.lineWidth = 2;for (var j = 0; j < data.length; j++) {endAngle = beginAngle + (Math.PI * 2 * (data[j] / total));ctx.fillStyle = colours[j];ctx.beginPath();ctx.moveTo(canvas.width/2, canvas.height/2);ctx.arc(canvas.width/2, canvas.height/2, canvas.height/2 - SPACE,beginAngle, endAngle, false);ctx.closePath();ctx.fill();ctx.stroke();beginAngle = endAngle;}}</script></head><body onload="draw();"><canvas id="myCanvas" width="350" height="300"></canvas></body></html>
该示例绘制了一个饼图。 它有三片,分别涂有不同的绿色阴影。
<style>canvas {background: #bbb}</style>
为了使图表的白色轮廓清晰可见,我们将画布的背景色更改为灰色。
var data = [170, 60, 45];
这是饼图说明的数据。
const SPACE = 10;
SPACE常数是从饼图到画布边界的距离。
endAngle = beginAngle + (Math.PI * 2 * (data[j] / total));
该公式计算当前绘制的切片的结束角度。
ctx.moveTo(canvas.width/2, canvas.height/2);ctx.arc(canvas.width/2, canvas.height/2, canvas.height/2 - SPACE,beginAngle, endAngle, false);ctx.closePath();
三种方法可用于绘制当前切片:moveTo(),arc()和closePath()。
ctx.fill();ctx.stroke();
我们绘制形状的内部和轮廓。
beginAngle = endAngle;
对于下一个切片,最后的终止角度成为起始角度。
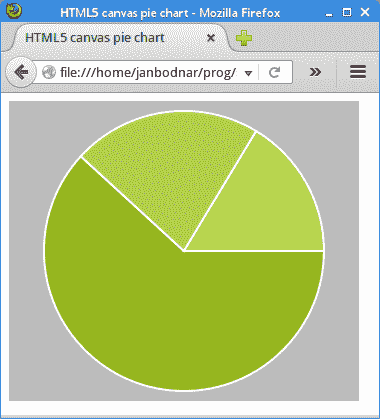
图:饼图
星星
下面的示例创建一个星形。
star.html
<!DOCTYPE html><html><head><title>HTML5 canvas star shape</title><script>function draw() {var canvas = document.getElementById('myCanvas');var ctx = canvas.getContext('2d');ctx.fillStyle = 'gray';var points = [ [ 0, 85 ], [ 75, 75 ], [ 100, 10 ], [ 125, 75 ],[ 200, 85 ], [ 150, 125 ], [ 160, 190 ], [ 100, 150 ],[ 40, 190 ], [ 50, 125 ], [ 0, 85 ] ];var len = points.length;ctx.beginPath();ctx.moveTo(points[0][0], points[0][1]);for (var i = 0; i < len; i++) {ctx.lineTo(points[i][0], points[i][1]);}ctx.fill();}</script></head><body onload="draw();"><canvas id="myCanvas" width="350" height="250"></canvas></body></html>
从一系列点创建星形。
var points = [ [ 0, 85 ], [ 75, 75 ], [ 100, 10 ], [ 125, 75 ],[ 200, 85 ], [ 150, 125 ], [ 160, 190 ], [ 100, 150 ],[ 40, 190 ], [ 50, 125 ], [ 0, 85 ] ];
这些是星星的坐标。
ctx.moveTo(points[0][0], points[0][1]);
我们使用moveTo()方法移动到形状的初始坐标。
for (var i = 0; i < len; i++) {ctx.lineTo(points[i][0], points[i][1]);}
在这里,我们使用lineTo()方法连接星星的所有坐标。
ctx.fill();
fill()方法使用定义的(灰色)颜色填充星形内部。
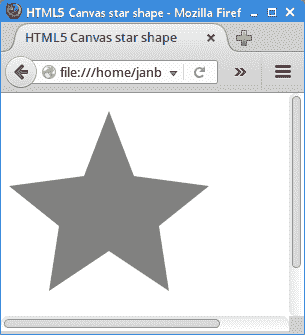
图:星星
三个圆圈
可以通过合成来创建新形状。 合成是确定画布中形状混合方式的规则。
three_circles.html
<!DOCTYPE html><html><head><title>HTML5 Canvas three circles</title><script>function draw() {var canvas = document.getElementById('myCanvas');var ctx = canvas.getContext('2d');ctx.lineWidth = 3;ctx.fillStyle = 'gray';ctx.beginPath();ctx.arc(90, 90, 60, 0, 2*Math.PI);ctx.stroke();ctx.beginPath();ctx.arc(120, 150, 60, 0, 2*Math.PI);ctx.stroke();ctx.beginPath();ctx.arc(150, 100, 60, 0, 2*Math.PI);ctx.stroke();ctx.globalCompositeOperation='destination-out';ctx.beginPath();ctx.arc(90, 90, 60, 0, 2*Math.PI);ctx.fill();ctx.beginPath();ctx.arc(120, 150, 60, 0, 2*Math.PI);ctx.fill();ctx.beginPath();ctx.arc(150, 100, 60, 0, 2*Math.PI);ctx.fill();}</script></head><body onload="draw();"><canvas id="myCanvas" width="400" height="350"></canvas></body></html>
该示例通过组合三个圆的轮廓来创建形状。 三个圆圈重叠。
ctx.beginPath();ctx.arc(90, 90, 60, 0, 2*Math.PI);ctx.stroke();
在画布上绘制了一个圆圈。
ctx.globalCompositeOperation='destination-out';
合成操作设置为destination-out。 在此模式下,目的地和来源不重叠的任何地方都会显示目的地。 在其他任何地方都显示透明性。
ctx.beginPath();ctx.arc(90, 90, 60, 0, 2*Math.PI);ctx.fill();
现在,相同的圆圈充满了灰色。 新图形将删除两个重叠的现有图形。 结果,仅保留轮廓。
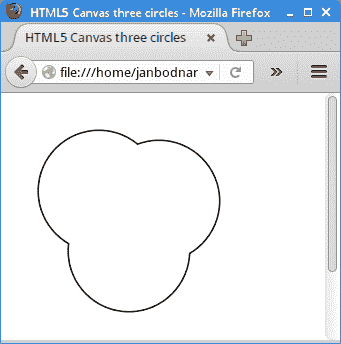
图:三个圆圈
在 HTML5 画布教程的这一部分中,我们介绍了 HTML5 画布中的一些基本形状和更高级的形状。

若有收获,就点个赞吧
0 人点赞
