Statistical methods (also known as model-based methods) assume that the normal data follow some statistical model (a stochastic model). The data not following the model (i.e. in low probability regions of the model) are deemed to be outliers. 统计方法(也称为基于模型的方法)假设正常数据遵循某种统计模型(随机模型)。不遵循模型的数据(即在模型的低概率区域)被认为是异常值。
Example: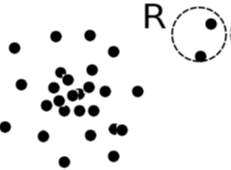
First use Gaussian (also called normal) distribution to model the normal data:
- For each object y in region
 , estimate
  , the probability that
  fits the Gaussian distribution
 - If
 is very low,
  is unlikely to be generated by the Gaussian model, thus an outlier
Effectiveness 有效性
The effectiveness of these statistical methods highly depends on whether the assumption of a statistical model holds in the real data. Analysts may need to understand something about the underlying data-generation process, perhaps a physical process, to select a suitable statistical model to use. The fit of the data to the model must be validated (and this is ironic because we are setting out to find what does not fit).这些统计方法的有效性在很大程度上取决于统计模型的假设在真实数据中是否成立。分析师可能需要了解底层数据生成过程的一些东西,也许是一个物理过程,以选择合适的统计模型来使用。数据与模型的契合度必须得到验证(这很讽刺,因为我们正在着手找出不契合的地方)。
There are many alternatives to statistical models available for this method, e.g., parametric vs. non-parametric. 对于这种方法,有许多统计模型的替代方法,例如,参数与非参数。
**
Parametric methods 参数方法
Assumes that the non-outlying data is generated by a parametric distribution with parameter  . e.g. Gaussian as above.
The probability density function of the parametric distribution  gives the probability that object
  is generated by the distribution. The smaller this value, the more likely
  is an outlier. 参数分布的概率密度函数给出了该分布生成对象的概率。该值越小,该对象越有可能是异常值。
Some methods based on fitting one or more Gaussian distributions, are covered here.
**
Non-parametric methods 非参数方法
Non-parametric methods do not assume an a-priori statistical model and determine the model from the input data. 非参数方法不假设先验统计模型,而是根据输入数据确定模型。
They are not completely parameter-free but consider the number and nature of the parameters are flexible and not fixed in advance. 它们不是完全无参数的,但考虑到参数的数量和性质是灵活的,并且不是预先固定的。
**
Histogram non-parametric method 直方图非参数方法
The parameters to be determined are bin width and bin boundaries. A simple threshold can then be applied to determine outliers as those objects falling in a low-frequency bin. 要确定的参数是料箱宽度和料箱边界。然后可以应用一个简单的阈值来确定落在低频箱中的异常值
Three problems occur:
- The method is very sensitive to the arbitrary bin boundaries. An outlier can fall outside a low-frequency class due only to the choice of starting point for binning along the x axis (and vice-versa).
- Too small bin size → normal objects in empty/rare bins, false positive箱子太小→空箱/稀有箱中的正常物体 假阳性
- Too big bin size → outliers in some frequent bins, false negative 箱子尺寸过大→一些常见箱子中出现异常值,假阴性
Kernel Density estimation non-parametric method 核密度估计非参数方法
Kernel density estimation fits a smoothing function to estimate a probability density distribution, to achieve something like a smoothed histogram. If the density estimated by the smoothed distribution is low in some region, that is, below some threshold, then the objects in the region are considered outliers. 核密度估计适合平滑函数来估计概率密度分布,以实现类似平滑直方图的东西。如果平滑分布估计的密度在某个区域较低,即低于某个阈值,则该区域中的对象被视为异常值。
The determination of data points to become outliers is dependent on the parameters to the fitting process (parameters similar to bin size and bin boundaries for histograms), but offers a smoother boundary behaviour than the discrete histogram. 确定成为异常值的数据点取决于拟合过程的参数(类似于直方图的面元大小和面元边界的参数),但是提供了比离散直方图更平滑的边界行为。

若有收获,就点个赞吧
0 人点赞
