Grid-based clustering
Space driven approach by partitioning the input space into cells. 通过将输入空间划分为单元的空间驱动方法。
Multiresolution grid data structure approach is used: quantize the object space into a finite number of cells that forms a grid structure. 使用多分辨率网格数据结构方法:将对象空间量化为形成网格结构的有限数量的单元。
Fast processing time which is independent of the number of data objects.
Possible clusters are predefined by the design of the grid and therefore the defined allocation of objects to grid cells; the problem becomes to retrieve the clusters that statisfy a query that includes statistical properties of desirable clusters. 可能的集群是由网格的设计预先定义的,因此对象的定义分配给网格单元;问题变成了通过包括期望聚类的统计属性的查询来检索统计的聚类。
STING: STatistical INformation Grid
In STING, the input space is divided in a hierarchical way
- At the first layer, the input space is divided into some rectangular cells. 在第一层,输入空间被分成一些矩形单元。
- Each cell at a high level is partitioned to form a number of cells at the next level. 高层次的每个单元被划分以形成下一层次的多个单元 。
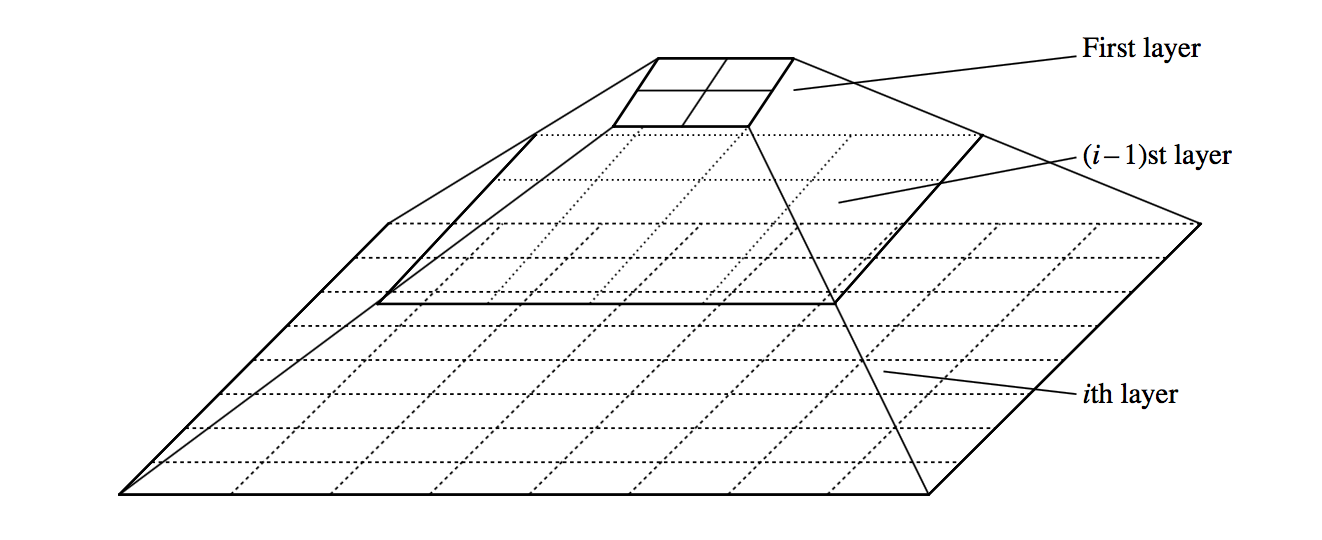
> Hierarchical structure for STING clustering.
- Precomputed statistical parameters 预计算的统计参数:
- Statistical informations such as count, mean, maximum, and minimum, of each grid cell is precomputed and stored. 每个网格单元的统计信息(如计数、平均值、最大值和最小值)已预先计算并存储。
- Statistics of the bottom level cells are directly computed from the data. 底层单元格的统计数据直接从数据中计算得出。
- Statistics of a higher level cell can be computed based on lower-level cells 可以基于较低级别的单元格来计算较高级别的单元格的统计数据
- Answer spatial data queries using precomputed statistics 使用预计算统计信息回答空间数据查询
- Top down approach:
- Start from a pre-selected layer - typically with a small number of cells
- Compute the confidence interval reflecting the cell’s relevance to the given query
- Irrelevant cells are removed
- Children of remaining cells will be examined
- Repeat until the bottom layer is reached
- The regions of relevant cells, which satisfy the query, are returned
- Query example:
- Select the maximal regions that have at least 100 houses per unit area and at least 70% of the house prices are above $400K and with total area at least 100 units with 90% confidence
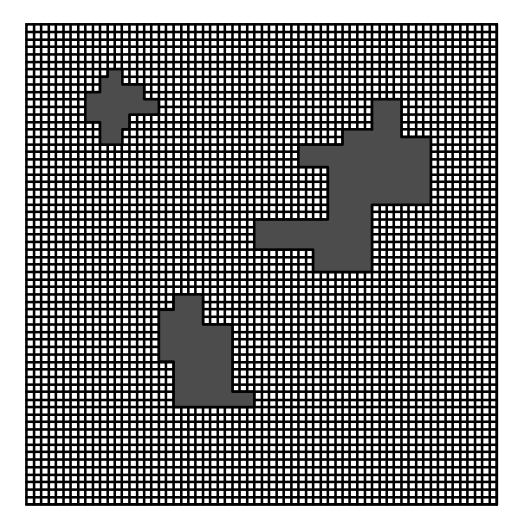
- > Example of clustering result obtained from a query (Wang et al, 1997)
- Advantage
- Grid-based computation is query-independent 基于网格的计算与查询无关
- Grid structure facilitates parallel processing and incremental updating 网格结构便于并行处理和增量更新
- Computational efficiency: STING goes through the database once to compute the statistical parameters of the cells 计算效率:STING对数据库进行一次检查,以计算细胞的统计参数
Disadvantage
- Sensitive to bottom level granularity 对底层粒度敏感
- If the granularity is very fine, the cost of processing will increase substantially 如果粒度非常细,加工成本将大幅增加
- if the bottom level of the grid structure is too coarse, it may reduce the quality of cluster analysis 如果网格结构的底层太粗糙,可能会降低集群的质量
- All the cluster boundaries are either horizontal or vertical, and no diagonal boundary is detected 所有聚类边界都是水平或垂直的,并且没有检测到对角线边界
- Sensitive to bottom level granularity 对底层粒度敏感
Q & A
- I interpret “grid” as a 3D structure, where layers are 2D structures at different levels of the grid, implying that the layer only has information on two features.
Some predefined number of dimensions are chosen in advance to aggregate over. Let’s say 2 (and yes, that makes sense for the spatial data application, which is most usual, but not necessary). Let’s say those 2 are “lat” and long”. Then each layer going up up the grid will partition lat and long into bigger and bigger intervals of space. The statistics stored at some cell in some layer correspond to the aggregate for a fixed number of cells in the layer below, where spatial resolution is finer. This is very different to a cuboid where each dimension is either aggregated or not (although it is close to a conceptual hierarchy where the hierarchy is stuctured in a very particular way). Aggregation happens here over pre-selected intervals of pre-selected dimensions only. - What exactly separates a layer from the layer directly above or below it?
A pre-defined design decision: each higher up cell represents (in terms of the statistical data stored) all of its sub-intervals for each dimension at the level below. - Exactly what data is on a single layer of the grid?
The statistical summaries are held in each cell which represents a fixed interval over each of the fixed dimensions selected. The statistical summaries are very particular measures (that include a statistical distribution) and these particular measures are required to give the advantages claimed. - How do we decide the partitioning between layers?
- What queries are you trying to optimise? You choose the dimensions; you choose the intervals at each level. 2D spatial dimensions are most common.

若有收获,就点个赞吧
0 人点赞
