Assuming that data is generated by a normal distribution could often be overly simplified. 假设数据是由正态分布生成的,通常会过于简化。
Example
If the data below is modelled as a normal distribution along either axis then objects between the two clusters C1 and C2 will not be captured as outliers since they are close to the estimated mean of the data. 如果下面的数据被建模为沿任一轴的正态分布,那么C1和C2这两个集群之间的对象将不会被捕获为异常值,因为它们接近数据的估计平均值。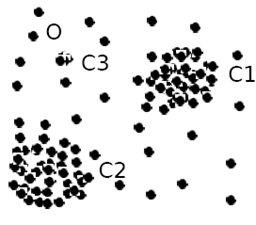
Instead, we assume data is generated by multiple distributions, for example two as here. 相反,我们假设数据是由多个分布生成的
For any object o in the data set, the probability that o is generated by the mixture of the two distributions is given by
where  and
and  are the probability density functions of
  and
and 
Then we can use an expectation maximisation algorithm for probablistic model-based clustering to learn the parameters μ1, σ1, μ2, σ2 from data. Each cluster is then represented by one of the two normal distributions.
An object  is an outlier if it does not belong to any learned cluster, that is, the probability that it was generated by the combination of the two distributions is below some threshold.如果一个对象不属于任何已学习的聚类,也就是说,它是由两个分布的组合生成的概率低于某个阈值,则它是异常值。
We are not covering the expectation maximisation algorithm in the course but it is explained in the text. You can think of it as a generalisation of the method using maximum likelihood over a single fitted distribution.
Weakness
What happens to those objects in the region of C3 above? Well, if we have one or two distributions and _o _in the diagram is a genuine outlier then the higher local density of the collection of C3 objects means they are likely to be interpreted as non-outliers by the normal distribution-fitting.

若有收获,就点个赞吧
0 人点赞
