- What will we cover in the ML section of the course?
- Linear Regression 线性回归
- Linear function 线性函数
- What do we need?
- Linear Functions: One Feature 线性函数:单特征值
- Linear Functions: Many Feature
- Multiple Linear Regression 多特征值线性回归
- Optimization 优化器
- Multinomial Logistic Regression 多项式逻辑回归
- Classification 分类问题
- From Logits to Probabilities 从逻辑到概率
- Multinomial Logistic Regression
- Classification: Loss 分类问题:损失函数
- Classification: Cross-Entropy 分类:交叉熵
- Classification: Prediction
- Applying Linear Regression to Text
- Shortcomings of Linear Regression
What will we cover in the ML section of the course?
Modern Machine Learning (ML) methods for Natural Language Processing (NLP). 自然语言中要用到的机器学习方法
• Linear Classifiers 线性回归
• Representation (for documents/sentences) 文档和句子的表达
– Sparse vectors, Word2Vec, Latent Semantic Analysis
• Deep Neural Networks 深度神经网络学习
– MLPs, RNNs, Transformers
• Clustering 聚类
Machine learning overview
We want to create a program that can make predictions/inferences about things. 我们想创造一个程序,来预测和推论事物。
– given the text of an email, predict would a human consider this email as spam. 给出一个邮件的文本,来预测人们是否会认为这个邮件是垃圾邮件
– given the text of a movie review calculate a numeric review score 给出一段影评,预测评分。
One way we can do this is by having the program learn from examples (called a training dataset). 一个可行的实现的方法是我们通过程序学习已有的样本(训练集)。
– For example, the program learns what kinds of emails get labelled as spam. 比如, 用程序来判别哪些邮件被标记为垃圾邮件
– In this example, the goal is to make predictions about new emails 目标则是给新的邮件做预测
Supervised learning
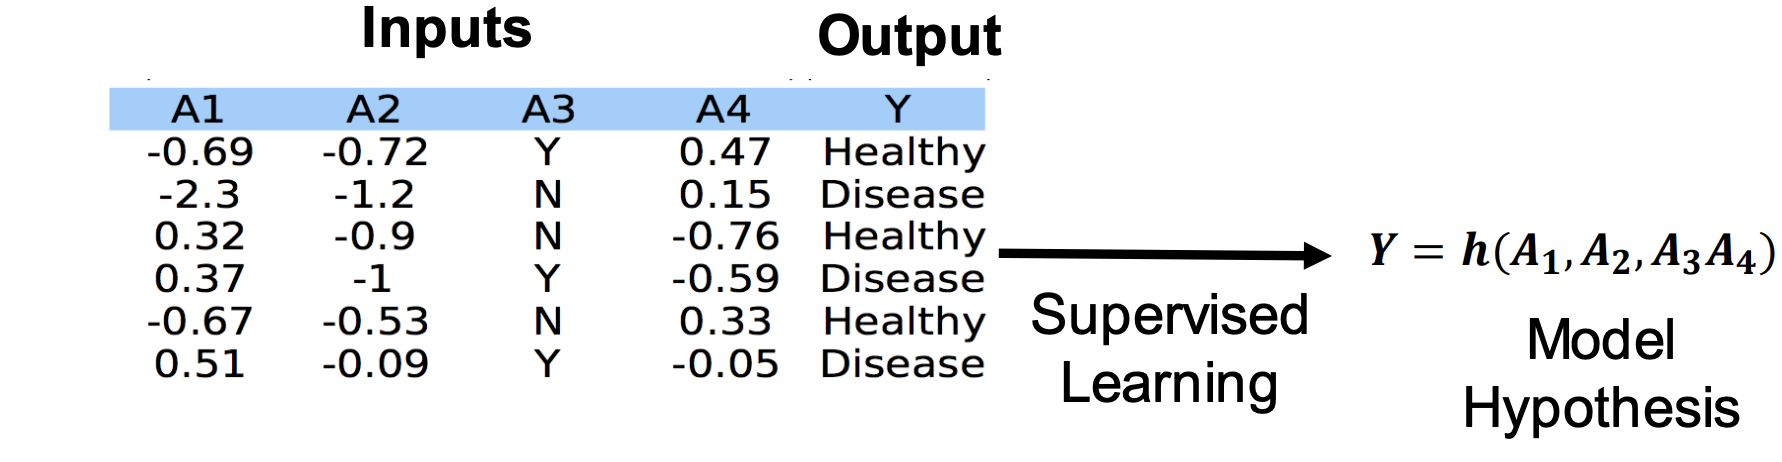
Goal: given both the inputs and the outputs for a training dataset, find a function h of the inputs that that returns the correct output (or as close as possible) 给定训练集的输入和输出, 找到一个函数h,可以通过输入,返回正确的输出。
目标:
• Categorical output ⇒ classification problem 分类输出: 分类任务
• Scalar output ⇒ regression problem 标量输出:回归问题
Terminology 术语
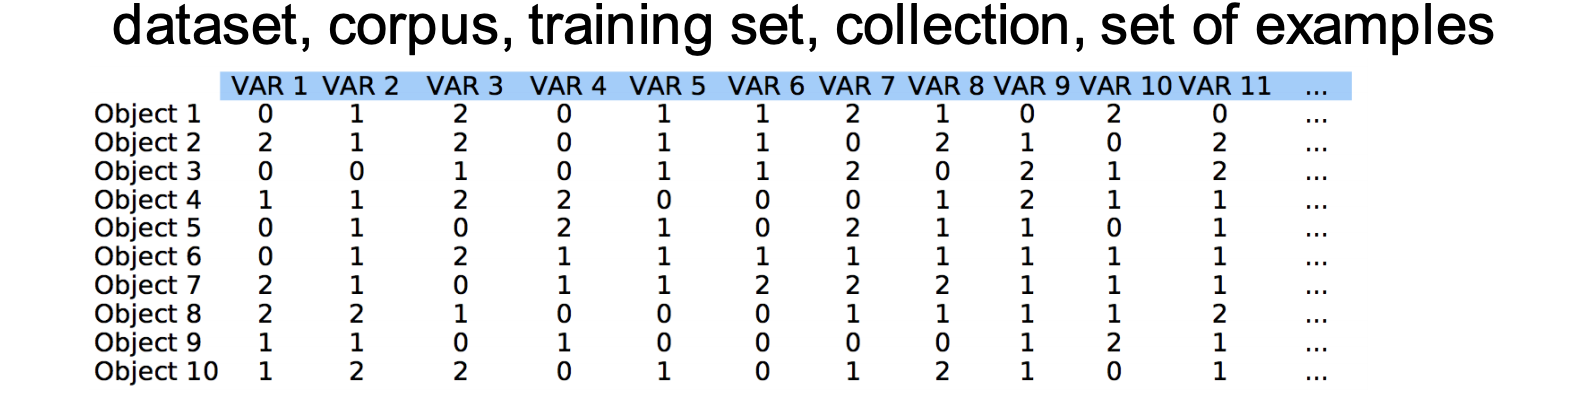
Objects (samples, observations, individuals, examples, data points) 对象(样本、观察、个人、示例、数据点)
• Variables (attributes, features) = describes a objects 变量(属性、特征): 描述一个对象
• Dimension = number of variables 维度 = 变量数量
• Size = number of objects For example: 尺寸 = 对象实体的数量
• Objects: samples, patients, documents, images… 对象举例: 病人,文件,图片
• Variables: genes, proteins, words, pixels… 变量: 基因、蛋白质、单词、像素…
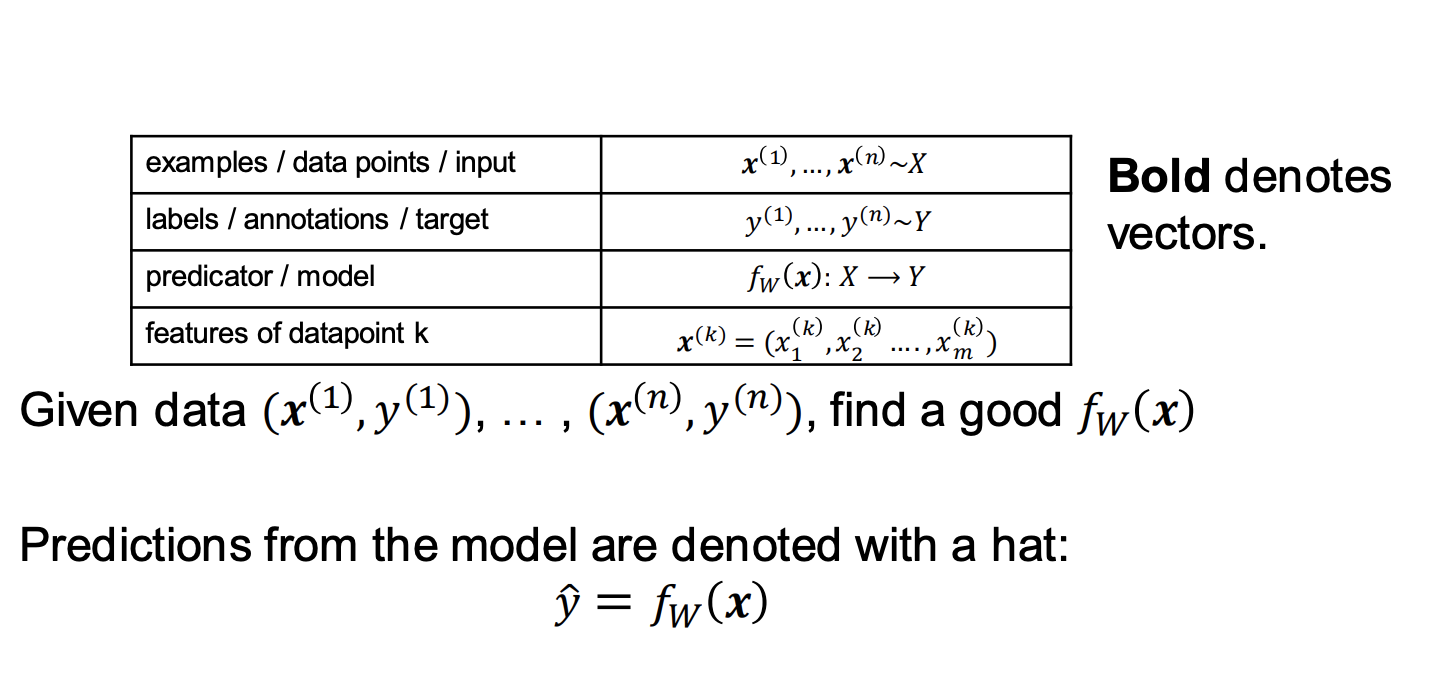
Notation 符号
Linear Regression 线性回归
Example
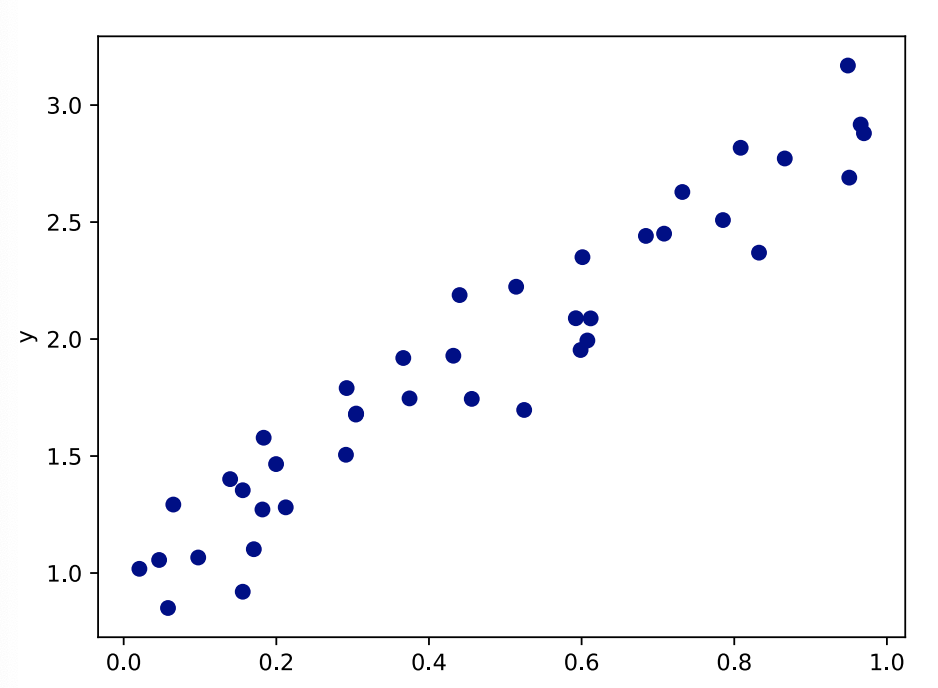
• Let this be our training dataset. 将这个作为我们的训练集
• We have sampled 40 different 𝑥 values, each 𝑥 value is labelled with its correct 𝑦 value.
• We want to create a program that can tell us what the 𝑦 value of a new point is. 通过创建一个程序,来告诉我们新点的y值是什么
• What do you predict the 𝒚 value of a point with 𝒙 = 𝟏. 𝟓 will be? 问题: 当x等于1.5的时候, 你预测y的值是多少?
• Key idea: find a simple function which explains your training dataset. 核心思路:找到一个简单的函数来解释你的训练集数据
• We need a function which maps inputs to outputs. 我们需要通过一个函数将输入映射到输出
• For all of the 𝑥 points in our training dataset, the output of our function should be as close as possible to the true 𝑦 value. 对于我们训练数据集中的所有𝑥点,我们函数的输出应该尽可能接近真实的𝑦值。
• Which function would you choose?
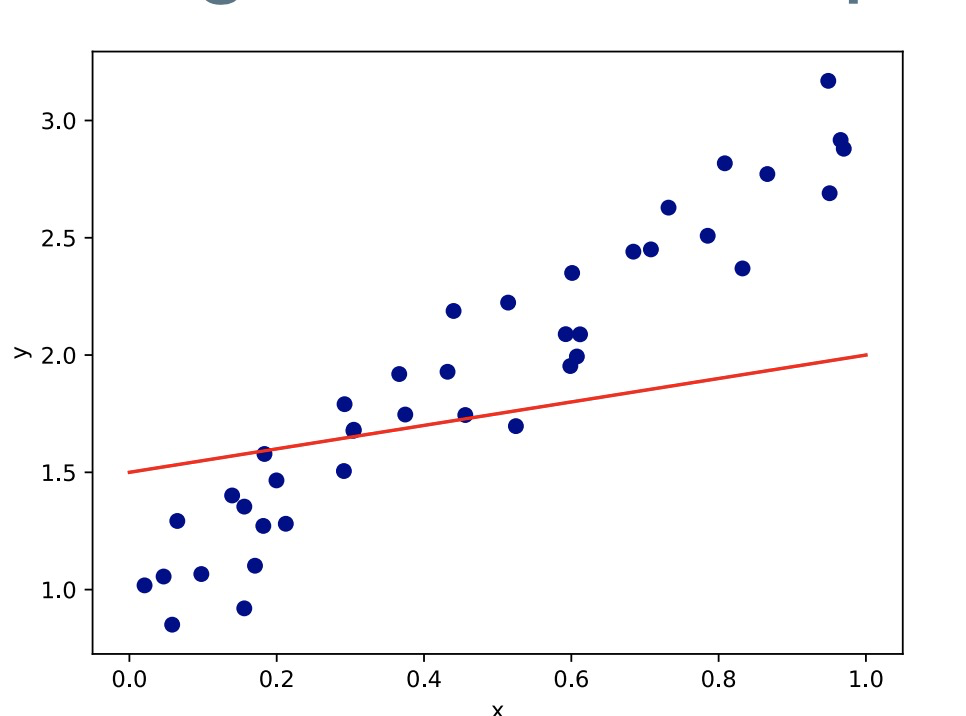
• Let’s try fitting a straight line through the points. 让我们尝试用一条直线来拟合所有的点。
• Is this a good model of the data?
• Let’s try fitting a straight line through the points.
• Is this a good model of the data?
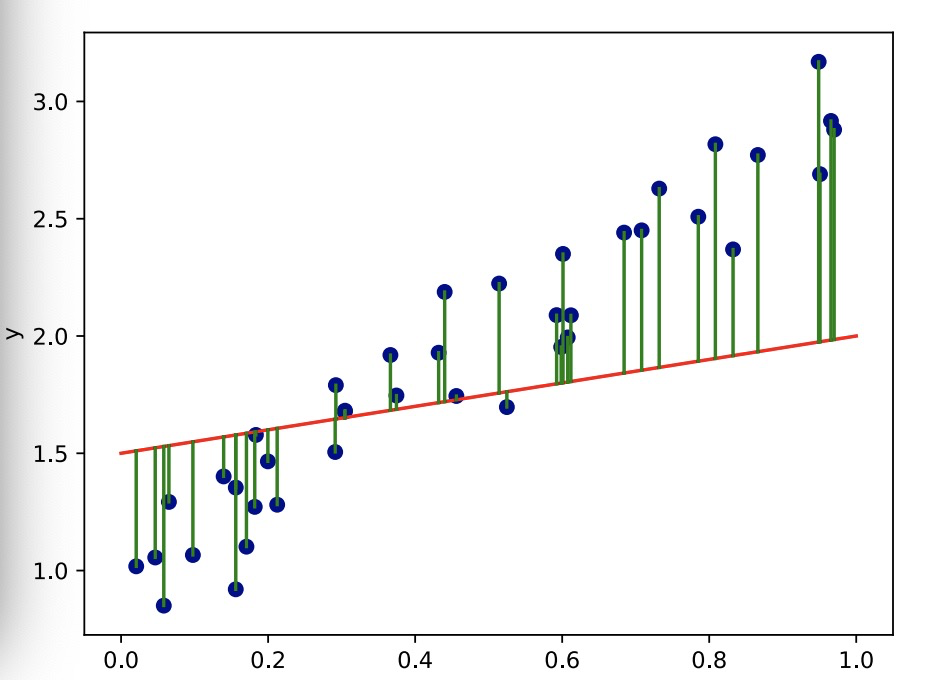
• No - there are large differences between our line (predicted y) and the target points (actual y).
• We can do better.
Linear function 线性函数
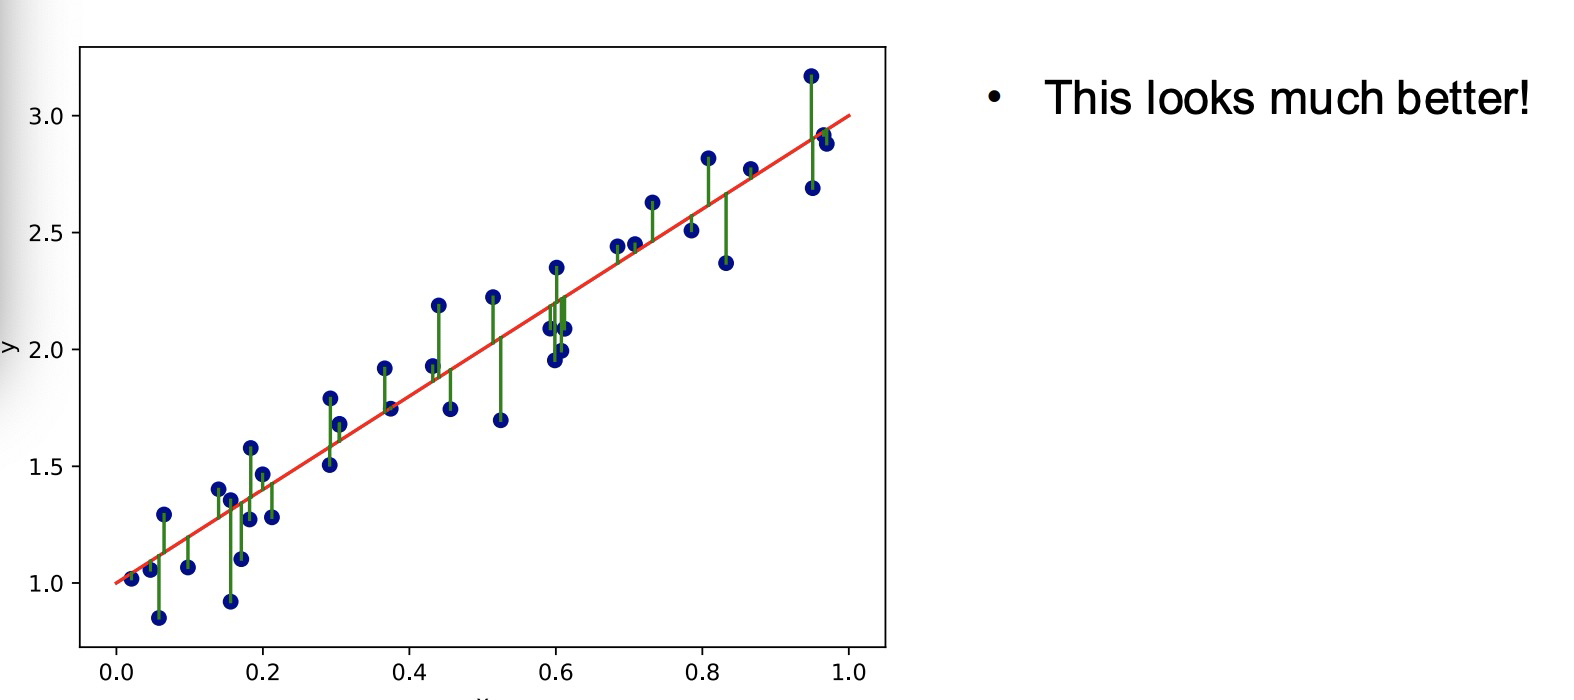
We find the best linear function to model our data points. 找到最好的线性函数来拟合
To make a prediction for a new point we just evaluate our function at that point. 用我们的函数去预测新点数值
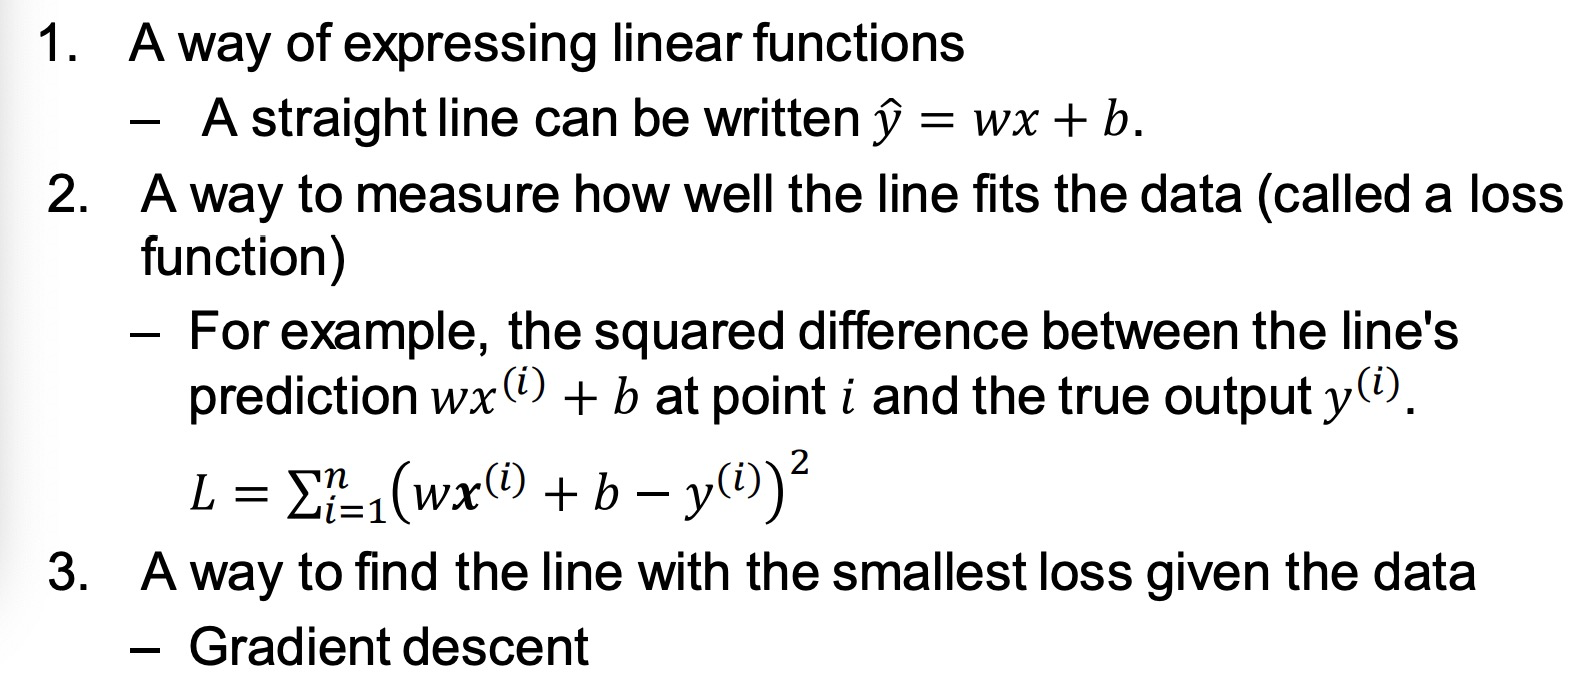
What do we need?
Linear Functions: One Feature 线性函数:单特征值
For one feature we have:
𝑦^ = 𝑤𝑥 + 𝑏
Where:
𝑤 - is the slope 斜率 of the line (parameter)
𝑥 - is the feature (input) 𝑏 - is the bias 偏差 (parameter)
𝑦^ - is the prediction of the target variable (output) 1
Linear Functions: Many Feature
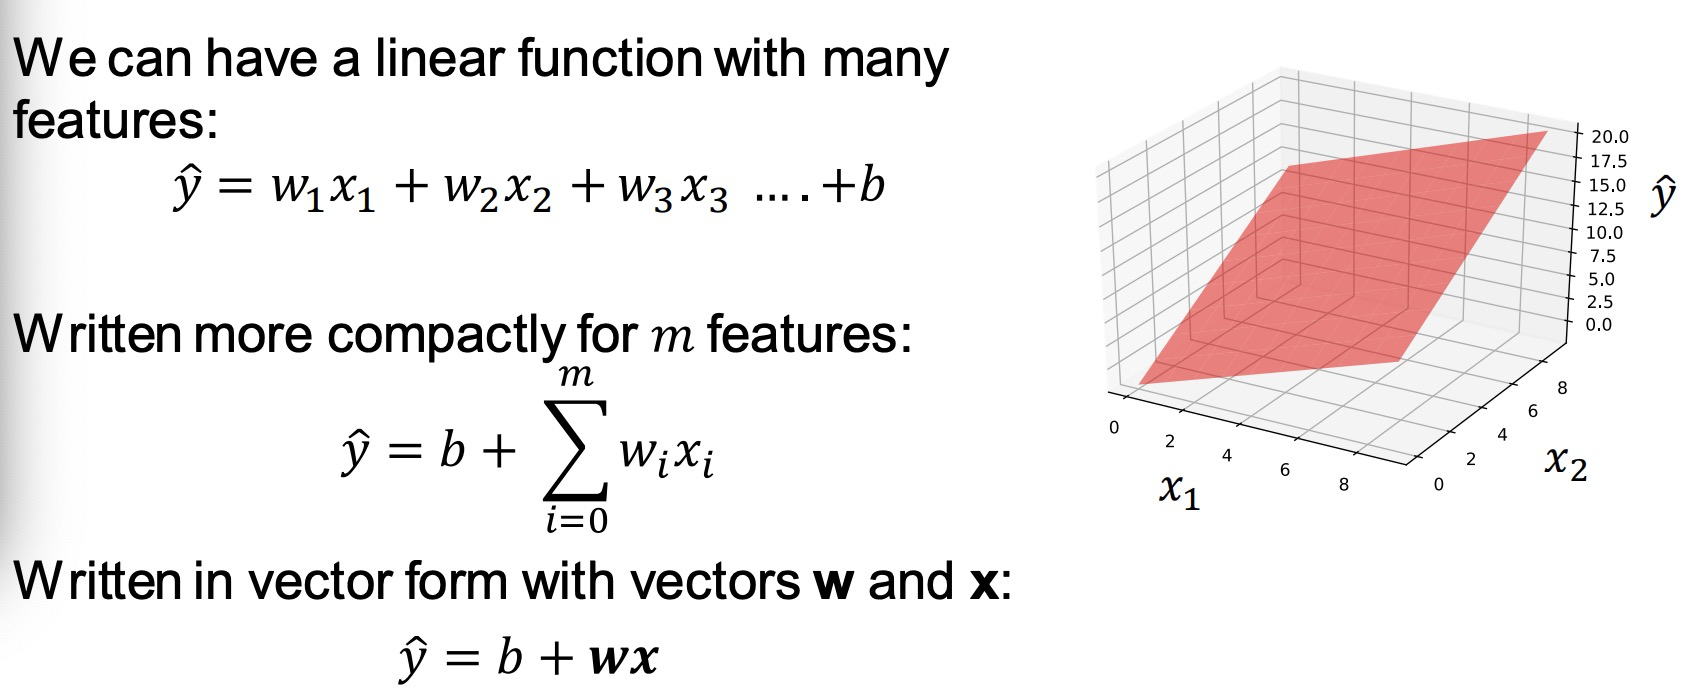
Multiple Linear Regression 多特征值线性回归
If we have more than one target per example, then we can use a different set of parameters for each target: 𝑦ො
y^1 = 𝑤1,1 𝑥1 + 𝑤1,2 𝑥2 + 𝑤1,3 𝑥3 …. +𝑏1 𝑦ො
y^2 = 𝑤2,1 𝑥1 + 𝑤2,2 𝑥2 + 𝑤2,3 𝑥3 …. +𝑏2 𝑦ො
y^3 = 𝑤3,1 𝑥1 + 𝑤3,2 𝑥2 + 𝑤3,3 𝑥3 …. +𝑏3
In matrix/vector form this is (for matrix W, and vectors: y^ , x, b): W为参数w的矩阵
𝒚^ = 𝑊𝒙 + 𝒃
This will be useful when we talk about multinomial logistic regression.
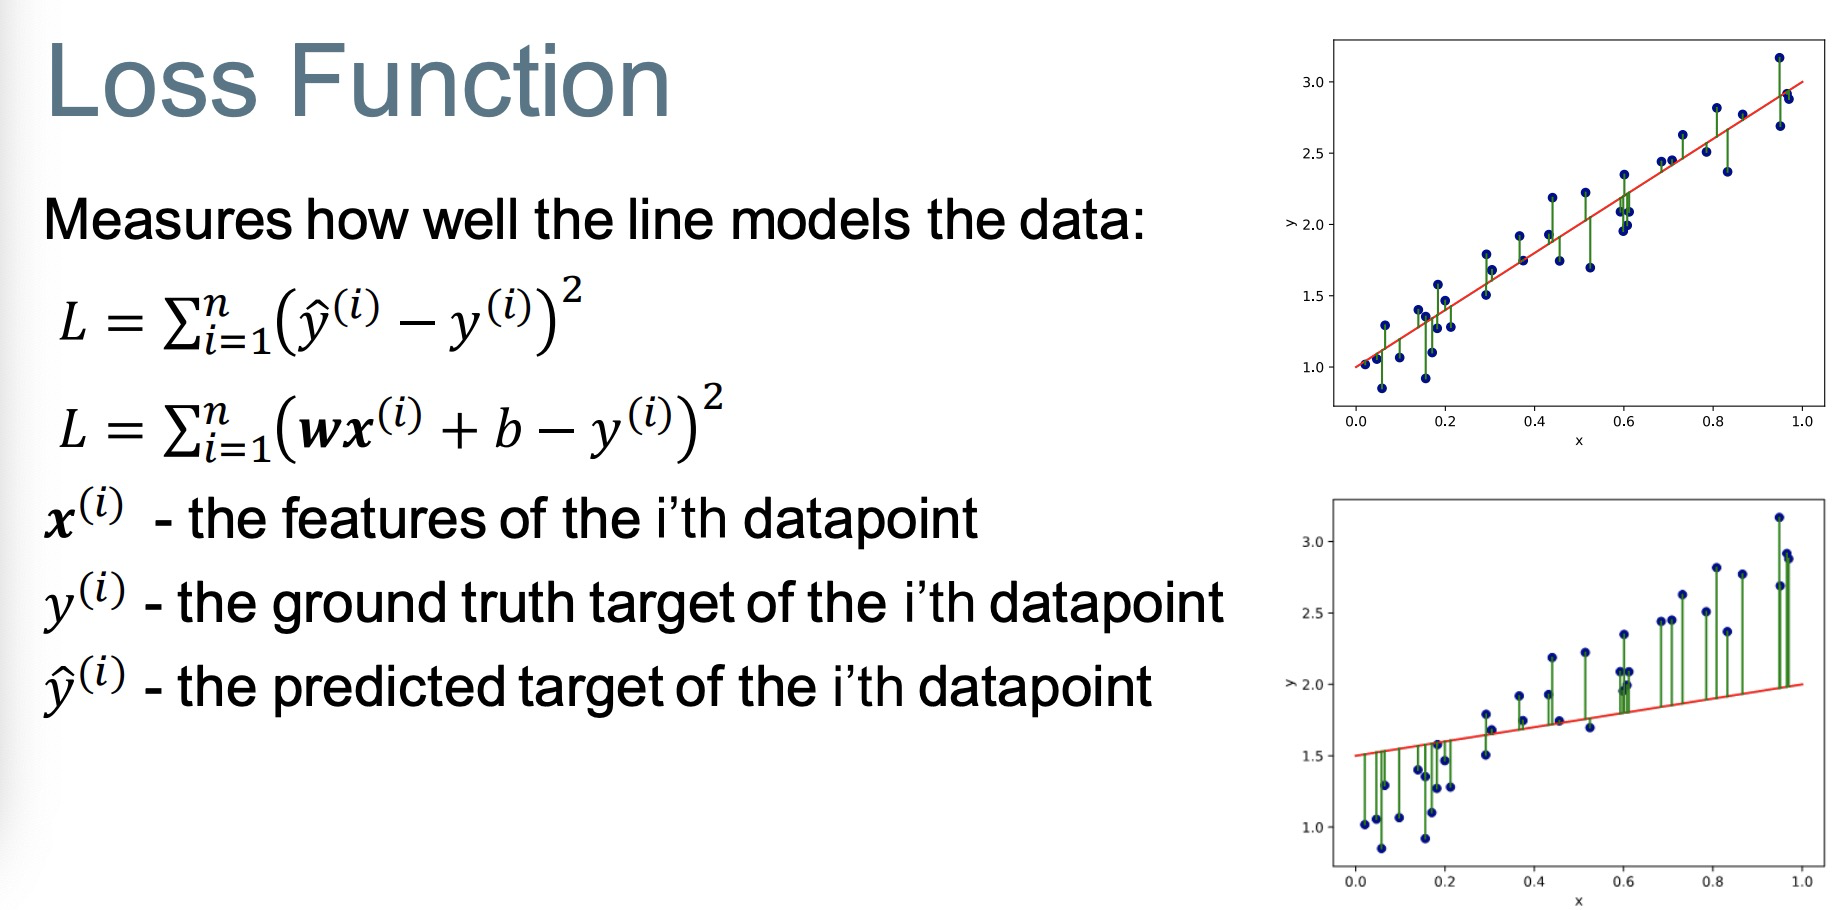
Loss function 损失函数
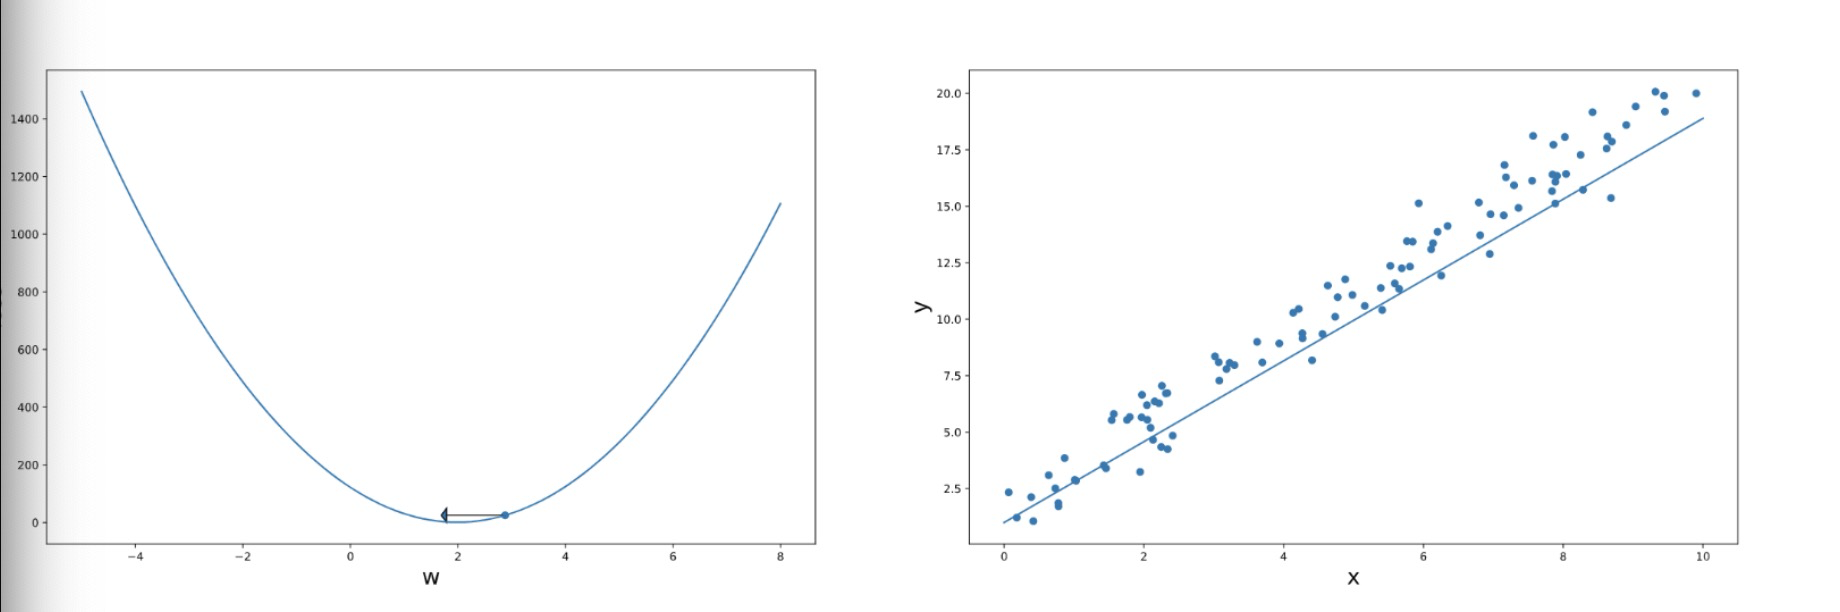
Optimization 优化器
We have a loss function 𝐿 which measures how good a particular line (𝑤,𝑏) is for our training dataset D.
• We want to solve: 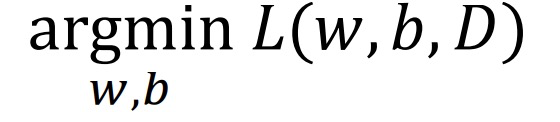 我们希望解决让损失函数最小。
• There are many different algorithms for solving optimization problems, gradient descent梯度下降 is a very popular one when everything is differentiable
Gradient descent 梯度下降

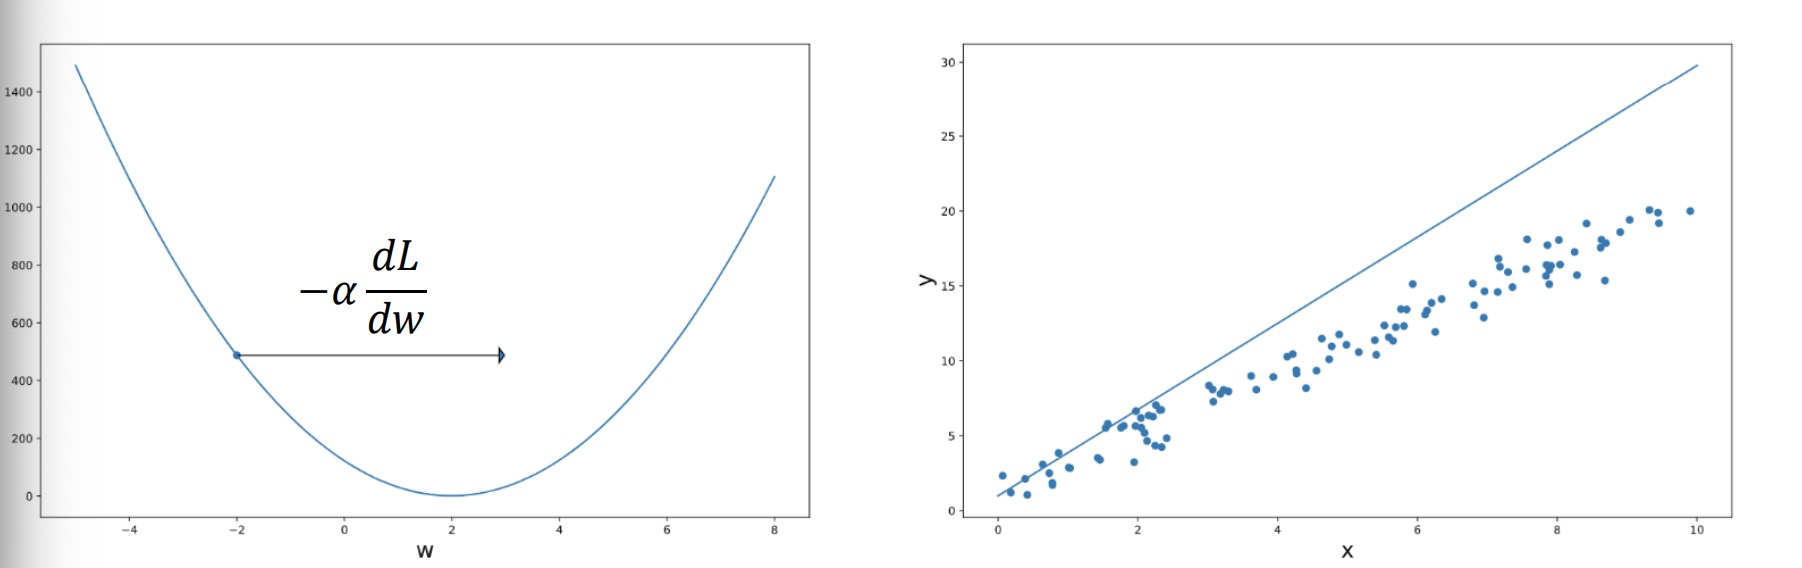
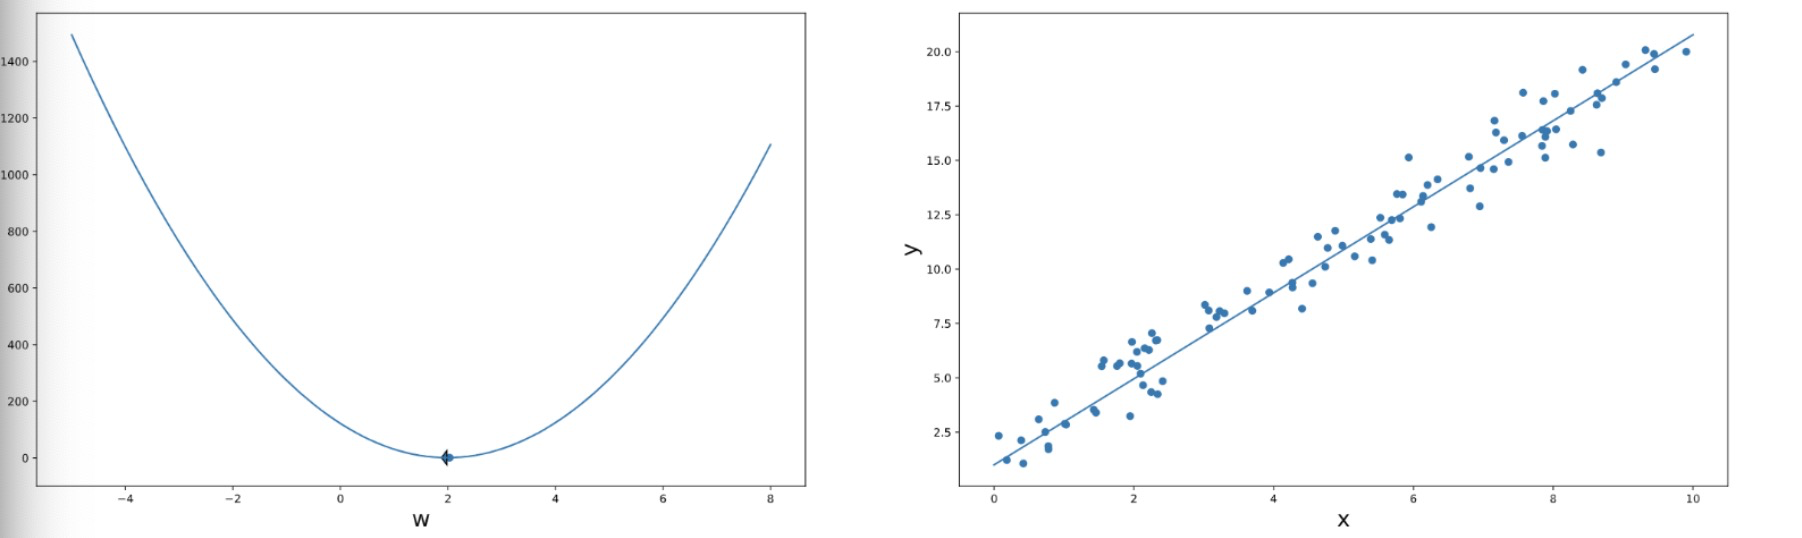


The role of learning rate 学习率
• The learning rate 𝛼 is a hyper-parameter that you set, it controls how much the weights are changed in each step.
• Too small 𝛼 ⇒ need to take many steps. 太小了则会导致需要太多步学习。
• Too large 𝛼 ⇒ may not converge 太大了可能会导致无法收敛
• Up to you to choose a good value of 𝛼
Multinomial Logistic Regression 多项式逻辑回归
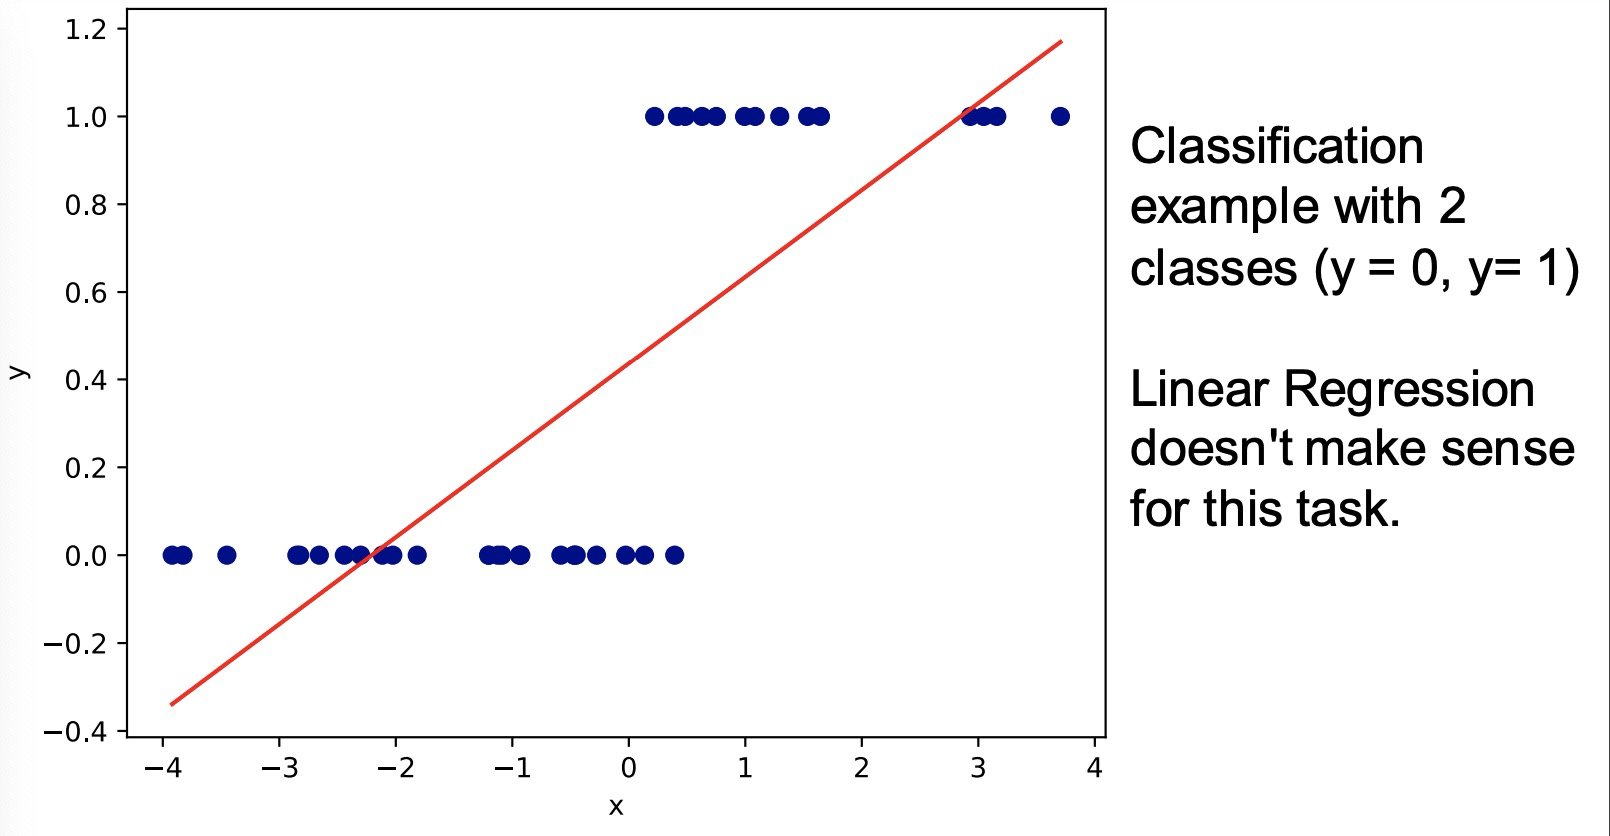
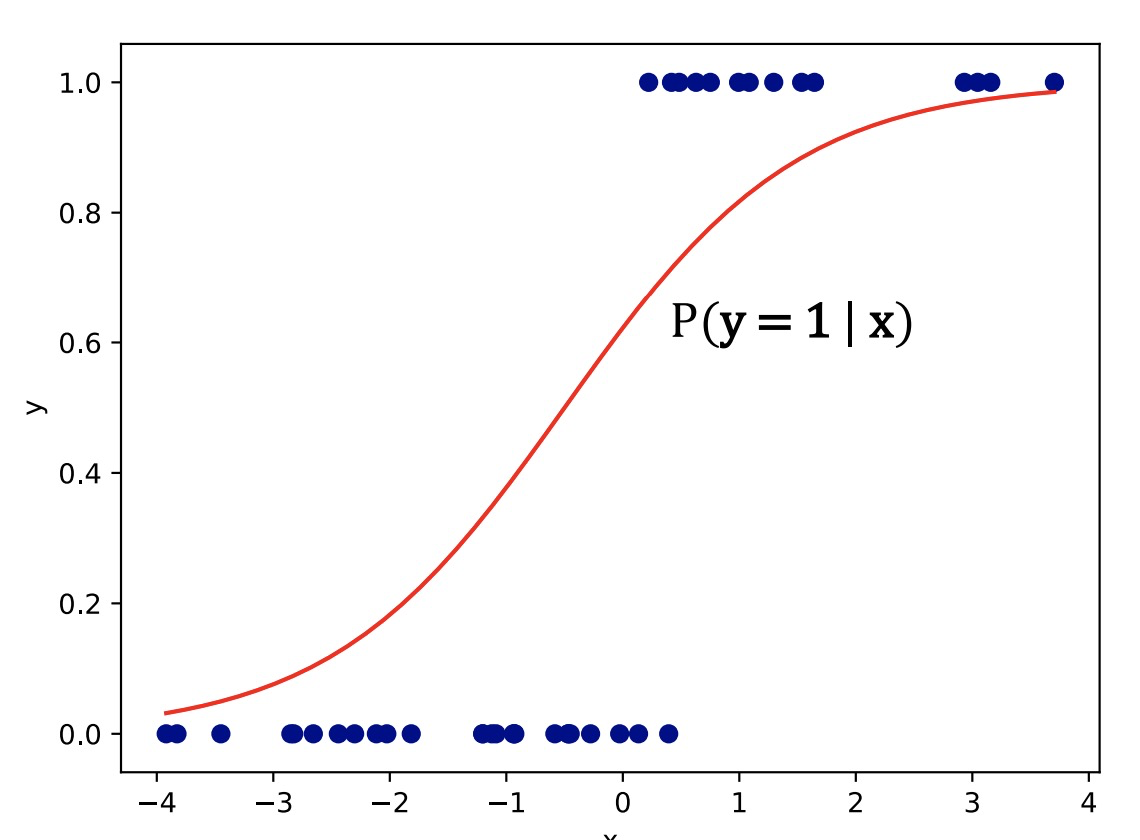
Classification 分类问题
- What if the target we wish to predict is discrete? 离散点的预测
- e.g. classifying emails as spam vs not spam.
- This isn’t a regression problem, so our linear model needs some changes. 这不是回归问题了,所以我们的线性模型需要一些改变。
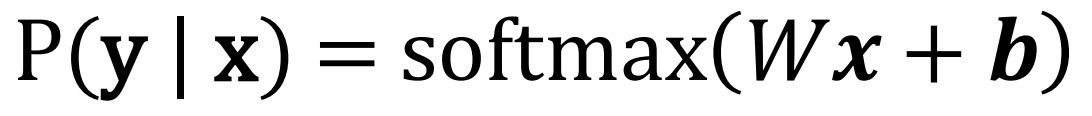
To use a linear model 𝑊𝒙 + 𝒃 (multiple linear regression) 使用线性模型
– We can modify the task to predicting the probability that an example belongs to each class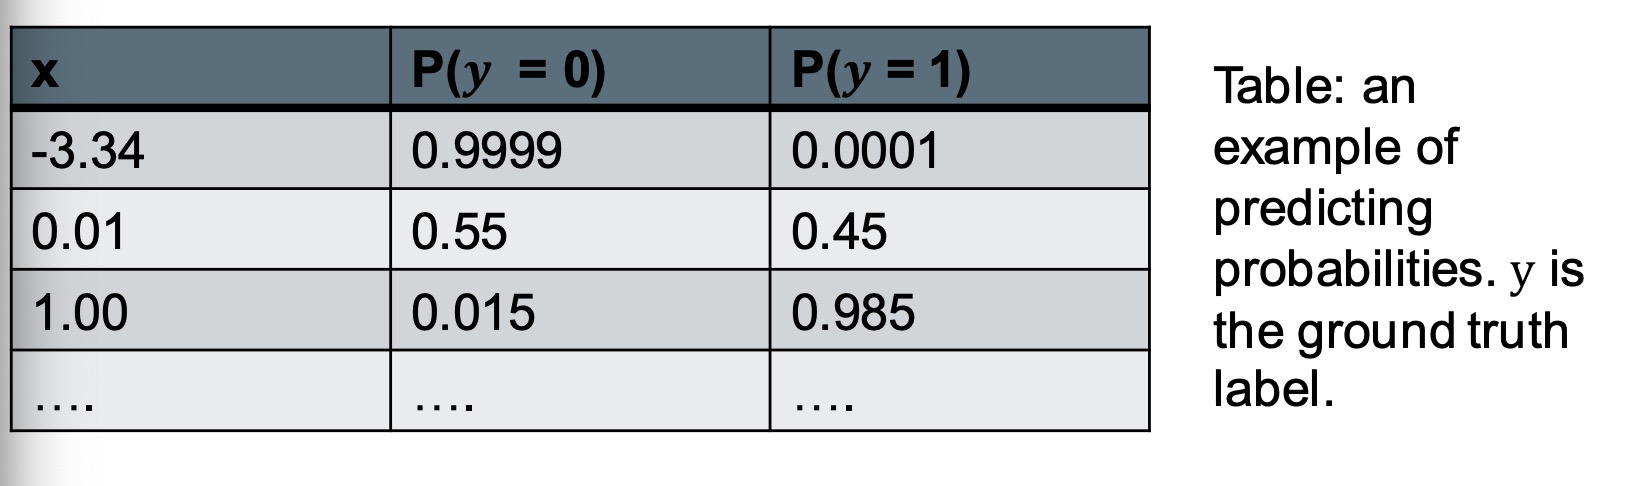
Suppose that each point can be labelled with one of 𝑂 different classes. 假设每个点都可以用一个不同的o类来标记。
Then our model 𝑃ത(𝒚|𝒙) = 𝑊𝒙 + 𝒃 outputs a vector of size 𝑂. 那我们的函数输出就会是一个尺寸为o的向量。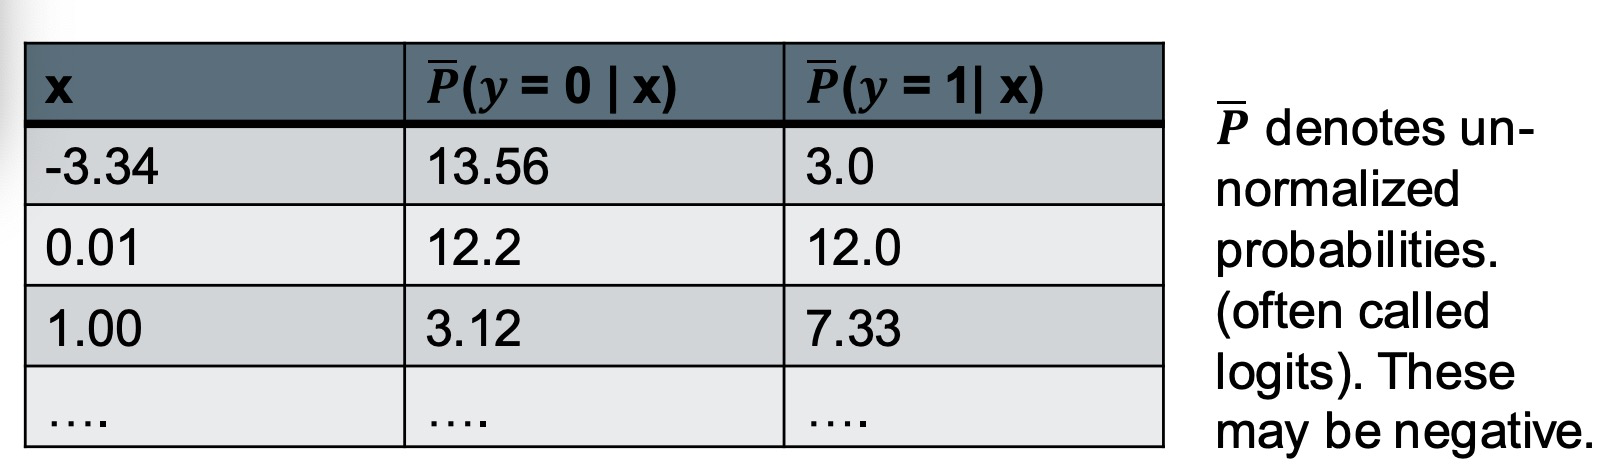
From Logits to Probabilities 从逻辑到概率
The output values of the linear model are not probabilities:
– Need all the output values to be non-negative. 需要所有的输出值为非零
– Need output values to sum up to 1 需要所有的输出值总和为1
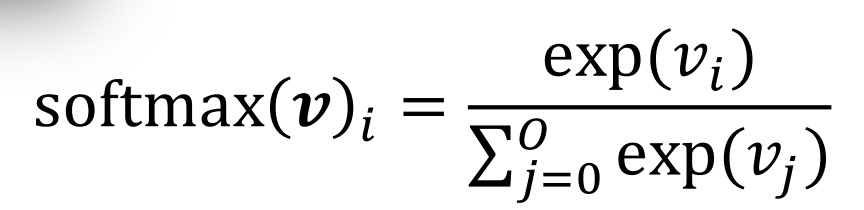
Step 1: Apply exp to all values. This makes them positive. 对所有的值对e求对数, 这可以让他们都为正数。
Step 2: Divide each value by the sum of all values. This makes them sum to 1. 然后除以所有值的和,这可以让最终的结果和为1
The result is a categorical probability distribution.
Multinomial Logistic Regression
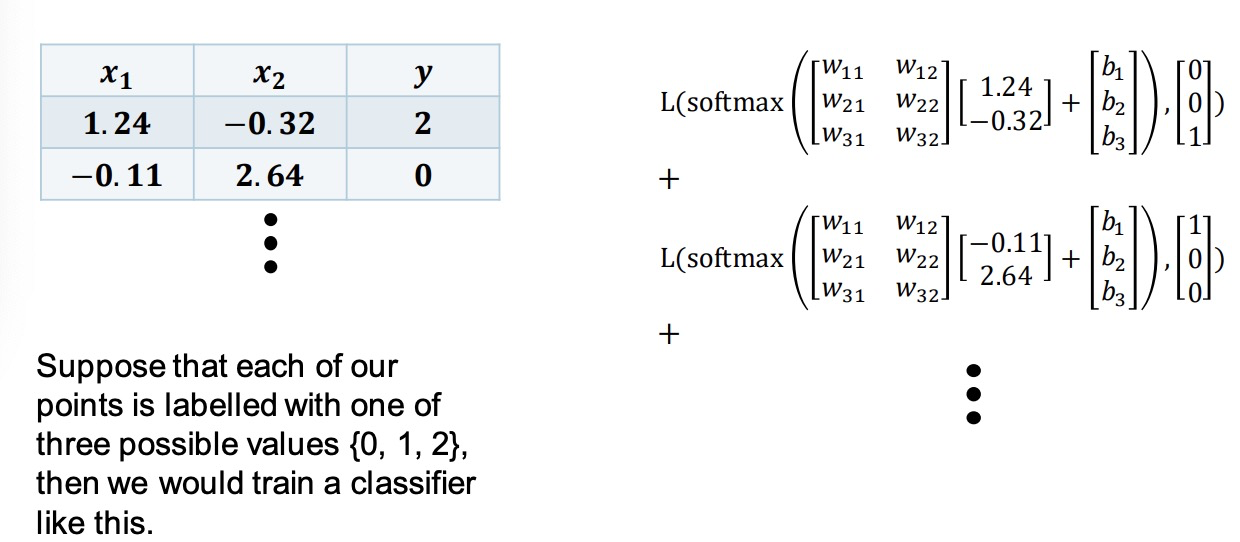
Classification: Loss 分类问题:损失函数
Compute loss between our predicted probabilities and one-hot encoding of class label y, i.e. the probability of the correct class should be 1, all others should be 0. 计算我们的预测概率和标签y的损失,即正确类的概率应该是1,所有其他的应该是0。
L(softmax 𝑊𝒙 + 𝒃 , 𝒚)
Classification: Cross-Entropy 分类:交叉熵
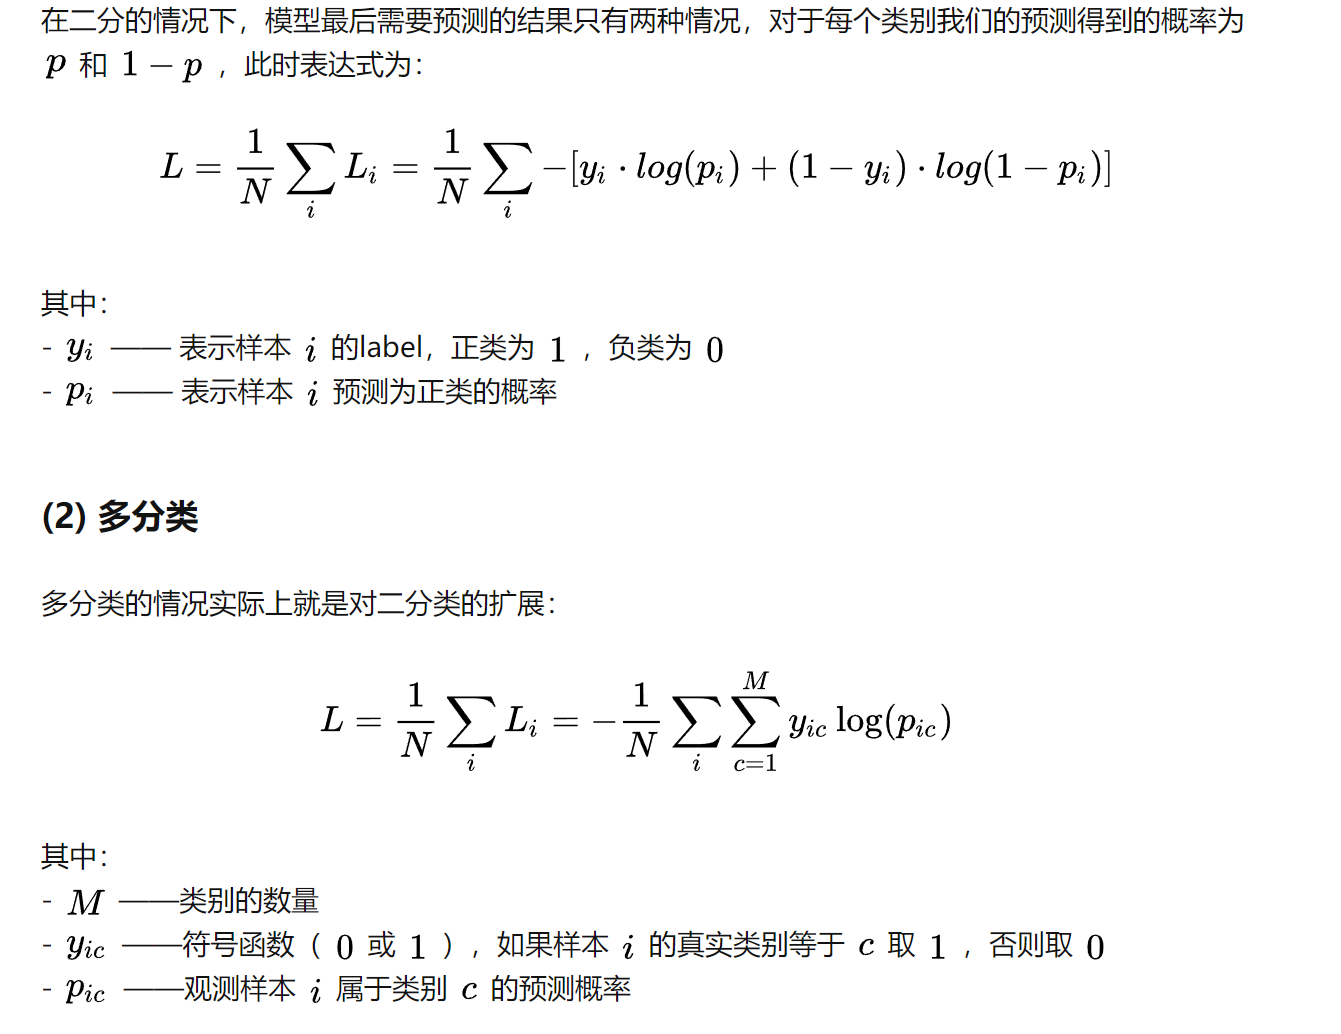
We could use the sum of squared differences as our loss function, just like for regression. 我们可以像回归一样,用差平方的总和来计算损失函数。
• In practice, using cross-entropy as the loss function for classification gives better results. 使用交叉熵作为分类的损失函数会产生更好的结果。
• Cross entropy for one datapoint: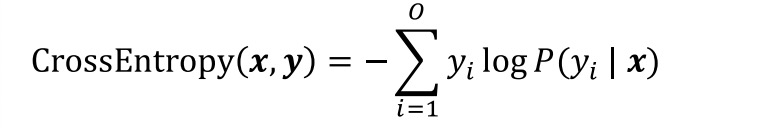
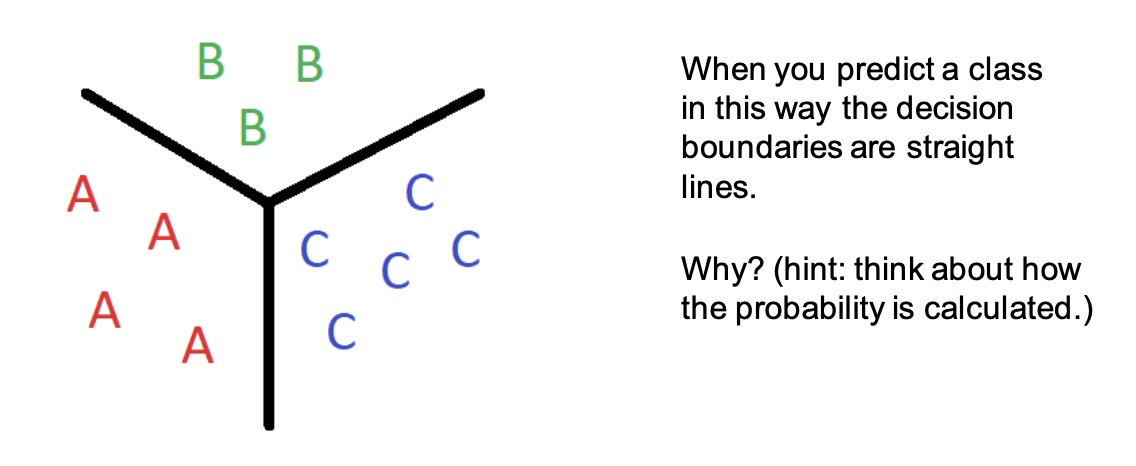
Classification: Prediction
To make a prediction for a new data point: 要对新数据点进行预测:
• using the model compute probabilities for each class. 使用模型计算每个类别的概率。
• predict the class with the largest probability.预测概率最大的班级。
Applying Linear Regression to Text
• Our model needs numeric (continuous) input values.
• How do we describe text with numbers?
– Think back to Information retrieval section. Can we do the same thing here?
– Next lecture: vector representations of text.
Shortcomings of Linear Regression
What do we do if our data looks like this?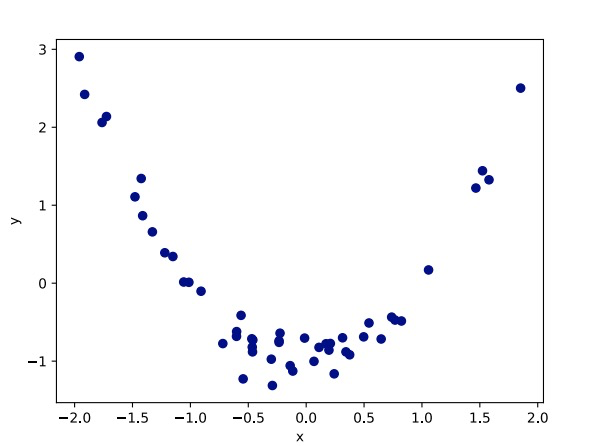

若有收获,就点个赞吧
0 人点赞
