A binary-tree-structured diagram 二叉树图, cawlled a dendrogram, is commonly used to represent the process of hierarchical clustering 经常拿来表示分层剧类. It shows how objects are grouped together (in an agglomerative method) or partitioned (in a divisive method) step-by-step.
The similarity of the cluster pairs selected at the step of their agglomeration or division may be shown on a similarity scale. 在聚集或分裂步骤中选择的聚类对的相似性可以在相似性标度上显示。
A final clustering of the data objects is obtained by cutting the dendrogram at the desired level, then each connected component at that level forms a cluster. 数据对象的最终聚类是通过在所需的级别切割树形图来获得的,然后该级别的每个连接组件形成一个聚类。
The desired level is usually determined by selecting a threshold for similarity amongst clusters, but the desired number of clusters could be a factor too. 期望的水平通常通过选择聚类之间的相似性阈值来确定,但是期望的聚类数量也可能是一个因素。
Here’s an example of a dendrogram on data objects {a,b,c,d,e}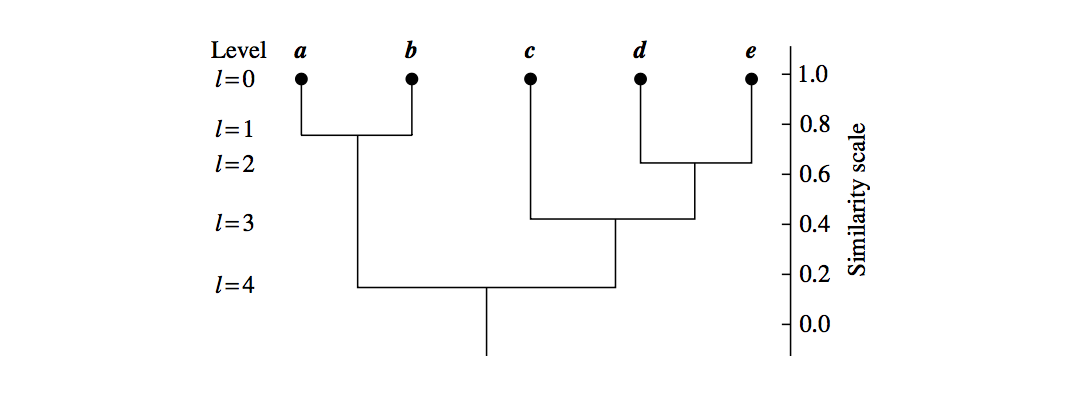
For example, by setting the similarity threshold to 0.5, one can obtain 3 clusters (a,b), (c), (d,e) from the dendogram.

若有收获,就点个赞吧
0 人点赞
