Classifier Models M1 vs. M2
- Suppose we have 2 classifiers, M1 and M2. Which one is better?
- Use 10-fold cross-validation to obtain mean error rates for M1 and M2,

- It may seem intuitive to choose the model with the lowest error rate
- However, these mean error rates are just estimates of error on the true population of future data cases
- What if the difference between the 2 error rates is just attributed to chance?
- Use a test of statistical significance
- Obtain confidence limits for our error estimates
Estimating Confidence Intervals: Null Hypothesis
- Null Hypothesis: M1 & M2 are the same
- Test the null hypothesis with t-test
- Use t-distribution with k-1 degree of freedom
- If we can reject null hypothesis, then
- we conclude that the difference between M1 & M2 is statistically significant.
- Chose model with lower error rate
- Perform 10-fold cross-validation (k=10)
- For i-th round of 10-fold cross-validation, the same cross partitioning is used to obtain
 and
and  .
. - Average over 10 rounds to get
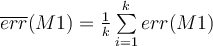 and similarly for
- t-test computes t-statistic with k-1 degrees of freedom:

where (using the variance for the population, as given in the text):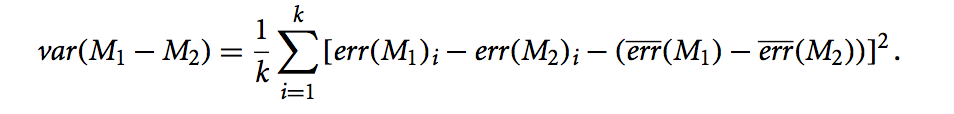
- To determine whether M1 and M2 are significantly different, we compute t-statistic and select a significance level.
- 5% significance levels: The difference between M1 and M2 is significantly different for 95% of population.
- 1% significance levels: The difference between M1 and M2 is significantly different for 99% of population.
- Based on t-statistics and significance level, we consult a table for the t-distribution.
- We need to find the t -distribution value corresponding to k − 1 degrees of freedom (or 9 degrees of freedom for our example) from the table (Two-sided).
Hidden from students:URLT-distribution tableURL
- We need to find the t -distribution value corresponding to k − 1 degrees of freedom (or 9 degrees of freedom for our example) from the table (Two-sided).
- If the t-statistic we calculated above is _not _between the corresponding value in the table and its negative (i.e. the corresponding value in the table multiplied by -1), then we reject the null hypothesis and conclude that M1 and M2 are significantly different (at the significance level we chose above).
- Alternatively, if the t-statistic we calculated above is between the corresponding value in the table and its negative, we conclude that M1 and M2 are essentially the same and any difference is attributed to chance.
- For i-th round of 10-fold cross-validation, the same cross partitioning is used to obtain

若有收获,就点个赞吧
0 人点赞
