Partitioning method 分区方法
Partitioning a database  of
of  objects into a set of
  clusters. The quality of cluster
  can be measured by the within-cluster variation, which is the sum of squared distances between all objects in
  and the centroid
  , defined as:
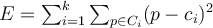
- Given
 , find a partition of
  clusters that optimises the chosen partitioning criterion
- Globally optimal: exhaustively enumerate all partitions
- Heuristic methods: k-means and k-medoids algorithms
- k-means: Each cluster is represented by the centre of the cluster
- k-medoids or PAM (Partition around medoids): Each cluster is represented by one of the objects in the cluster
K-means
Given
 , the k-means algorithm is implemented in four steps: 四步实现 K-means
- Arbitrarily choose a centre of
 clusters as the initial cluster centres 任意选择一个聚类中心作为初始聚类中心
 - Assign each object to the cluster to which the object is the most similar 将每一个对象归类于其最相似的聚类
- Update the cluster means, that is, calculate the mean value of the objects for each cluster 更新聚类的平均值——计算
- Go back to Step 2, stop when the assignment does not change 重复回到步骤2。直到聚类中心的赋值不变为止。
Illustration of the K-means algorithm (from Pattern Recognition & Machine Learning, Bishop).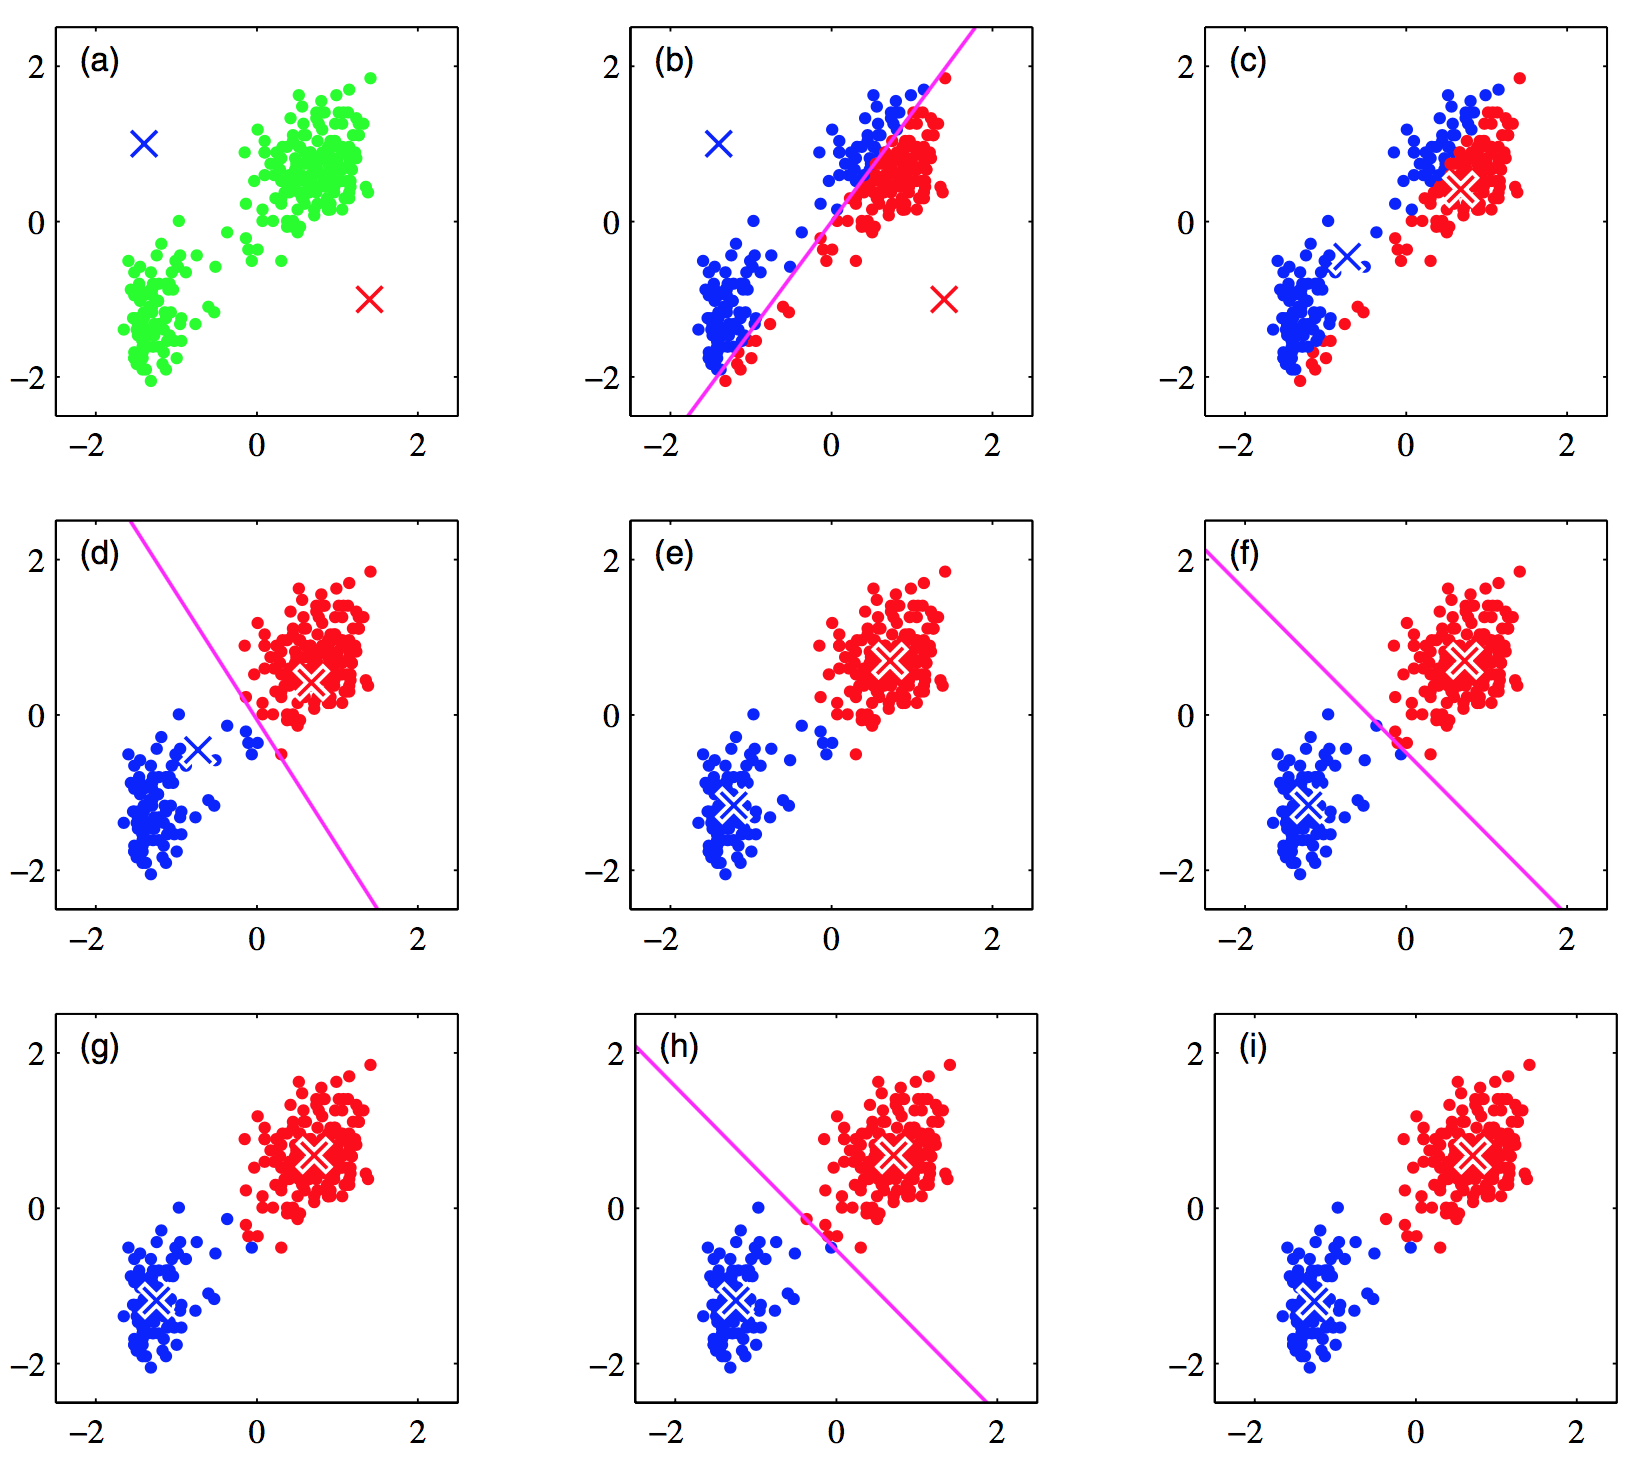
(a) Green points denote the data set in a two-dimensional Euclidean space. The initial choices for centres for and
and  are shown by the red and blue crosses, respectively.
(b) Each data point is assigned either to the red cluster or to the blue cluster, according to which cluster centre is nearer. This is equivalent to classifying the points according to which side of the perpendicular bisector of the two cluster centres, shown by the magenta line, they lie on. 根据哪个簇中心更近,每个数据点被分配给红色簇或蓝色簇。这相当于根据两个聚类中心的垂直平分线的哪一侧对点进行分类,用洋红色线表示。
(c) In the subsequent step, each cluster centre is re-computed to be the mean of the points assigned to the corresponding cluster.
(d)–(i) show successive steps through to final convergence of the algorithm.- Arbitrarily choose a centre of

若有收获,就点个赞吧
0 人点赞
