- What is data wrangling?
- What is data?
- Extracting data from the Web
- Data profiling数据概要分析
- Data profiling versus data mining 数据概要分析和数据挖掘
- Single versus multiple column profiling
- Statistics (single column)
- Benford’s law
- Dependencies 相关性
- Data visualisation
- Data profiling tools
- Data profiling with Python
- Data quality issues 数据质量问题
- Data cleanning
- Missing data
- Impute missing data
- Outliers and noisy data
- Smooth noisy data
- Redundant data 冗余数据
- Inconsistent data
What is data wrangling?
It is the (manual) process of converting raw data from various sources into another format to allow more convenient further processing by using a variety of tools and techniques
用工具和技术手动处理从各个来源的原始数据以便进行进一步的处理。
Also known as data munching, data cleansing, data preparation, data cleaning, data janitoring, extraction / transformation / loading (within data warehousing), etc.
Typically up to 90% of time and effort are spent in the first three steps!
Main data wrangling tasks
- Data extraction
- Data quality assessment
- Data profiling (exploration, summarisation, and visualisation) Data cleaning (transformation, reshaping, aggregation, reduction, imputation, parsing, standardisation)
- Data integration (schema matching and mapping, data matching, record linkage, deduplication, data fusion)
Outcomes of data wrangling tasks
- Understanding and characterisation of the quality aspects of a given data set or database Cleaned, standardised, consistent and integrated data in a format that is suitable for the further
- Processing and/or analytics tasks at hand
- Documentation of the data quality assessment, profiling, exploration and cleaning conducted
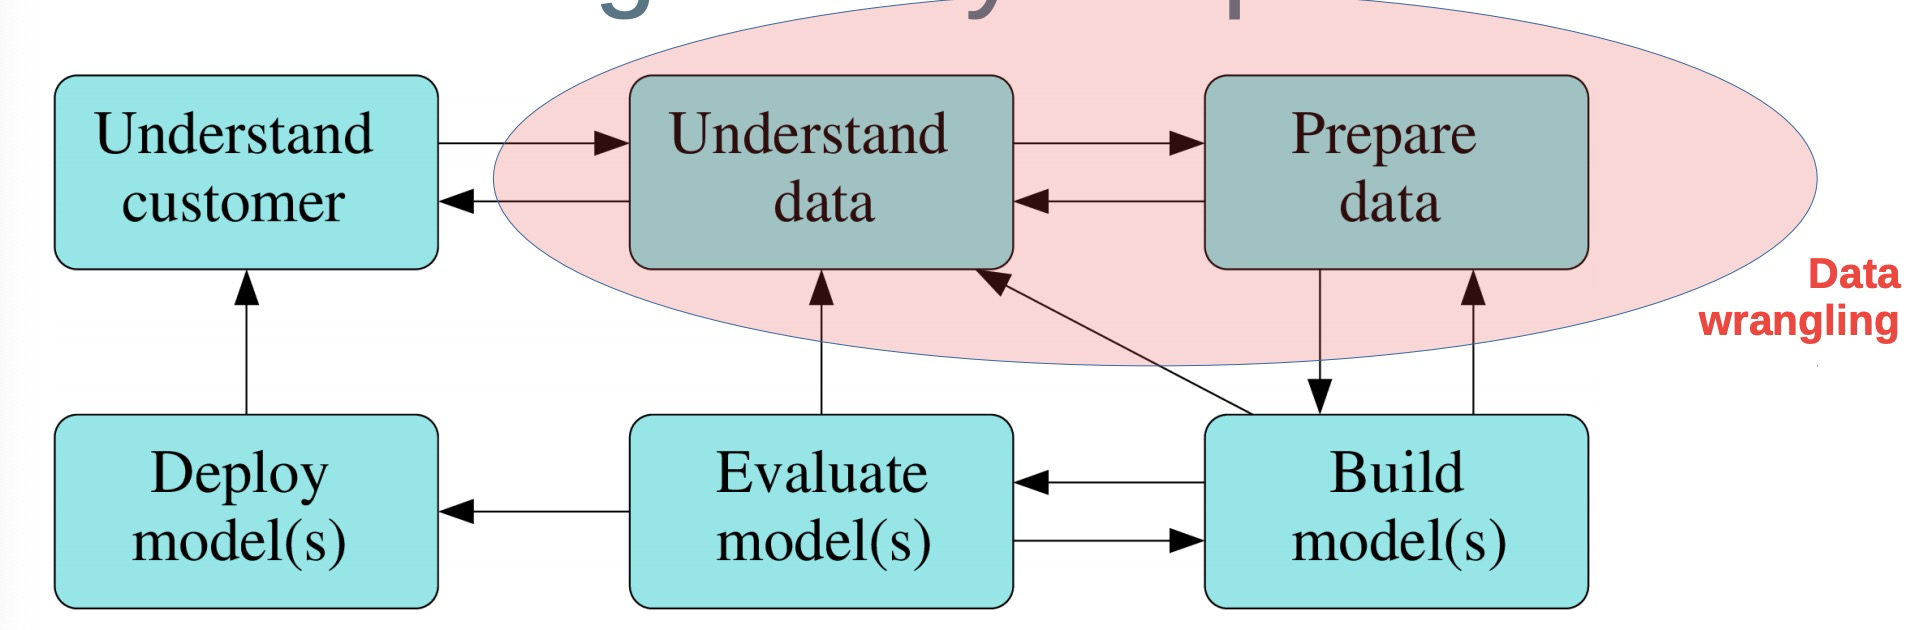
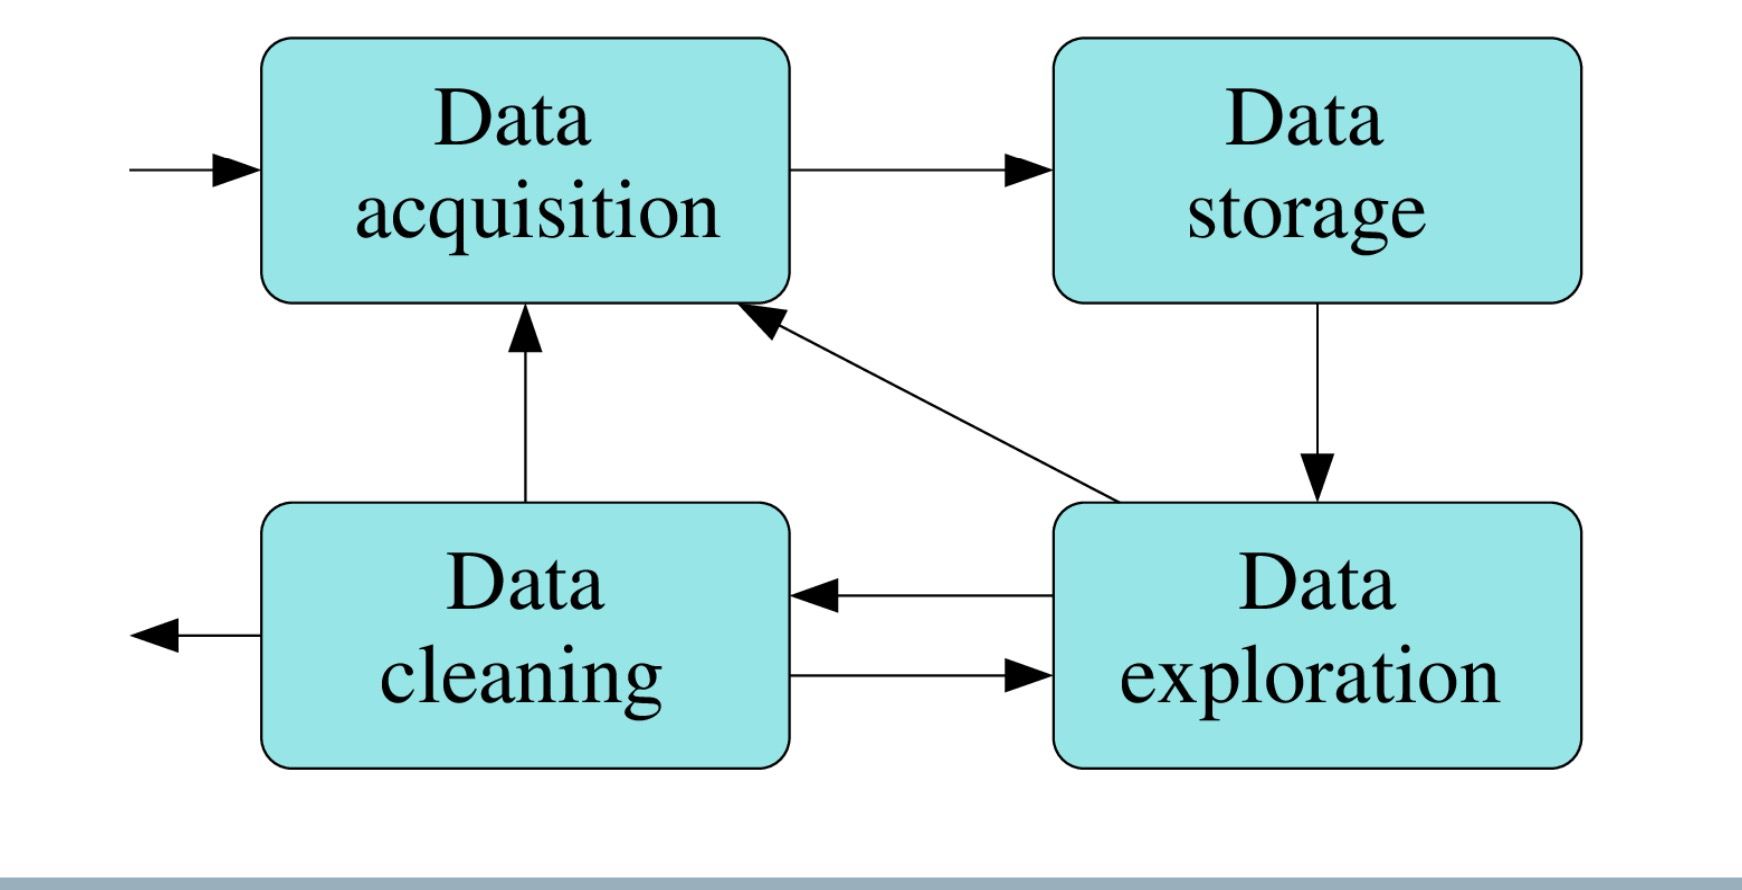
The data wrangling process
What is data?
- Data is how we store observations in reusable form
- Observations are about entities and their attributes, as well as relationships between entities
- Sometimes (ideally) entities have unique identifiers (products have barcodes, most Australians have a Tax File Number (TFN) or a Medicare number, books have ISBNs, etc.)
- Unique entity identifiers should be stable over time, accurate, complete, and robust (like a checksum in an identifier number)
Source of data
- relational databases
- data warehouses
- internet
- files
- Scientific instruments, experiments and simulations 科学仪器
- Sensors (often data streams) 传感器(数据流)
Types and measurements of data
- Numerical data
- Non-numerical data
- Series data
- Multimedia data
- Different mappings and conversions between data types
- Different data wrangling (and data analytics) techniques can handle different types of data
Formats of data
- Structured data
- Semi-structured data
- Free-format data (Mainly free-format text - ASCII or Unicode)
Data extraction 信息检索
- The process of retrieving data out of data sources for further processing and storage
- There are various data sources, some internal and some external to an organisation
- Unstructured data sources include emails, Web pages, PDFs, scanned and OCRed text (optical character recognition), audio reports (speechto-text), etc.
- Different sources require different extraction methods
- Certain sources might be poorly structured or even unstructured
- The process of extracting data from the Web is called Web scraping
Extraction, transformation and loading (ETL)
- ETL is an integral part of data warehousing (more on DW later)
- Extraction involves retrieving data from disparate sources, such as transactional databases in an organisation or external sources 提取涉及从不同来源检索数据,例如 作为组织或外部来源的事务数据库
- In the loading phase, the extracted data are loaded into a staging (temporary) area of a data warehouse, where extraction logic (rules and pattern matching) are applied to ensure only suitable data are added to the warehouse 在加载阶段,提取的数据被加载到暂存区 数据仓库的(临时)区域,其中提取逻辑 (规则和模式匹配)用于确保只适合 数据被添加到仓库中
- In the transformation phase阶段 the selected data are transformed so they conform to the structure and formats of the data warehouse 在转换阶段,所选数据被转换 它们符合数据仓库的结构和格式
Extracting data from the Web
- Collection and cleaning of Web data is required in many Web data-driven projects
- Examples: price comparison, product review, real estate listings, stock market, web mashup, web data integration, and research
- Websites contain unstructured and semi-structured data (HTML format)
- Need to extract data into structured format from unstructured data
Ways to extract from web
- APi
- Web scraping techniques 爬虫
Understanding the target website
- Check restrictions about crawling – robots.txt 检查爬虫规则
- Examine sitemap file - links to all Web pages 检查站点地图文章
- Estimate Web site size – determines efficiency of crawling (Web site with million of pages requires distributed downloading) 估计网站规模–确定效率
- Technology used – static/dynamic content and interactive determine how we crawl 技术的使用(静态/动态交互)
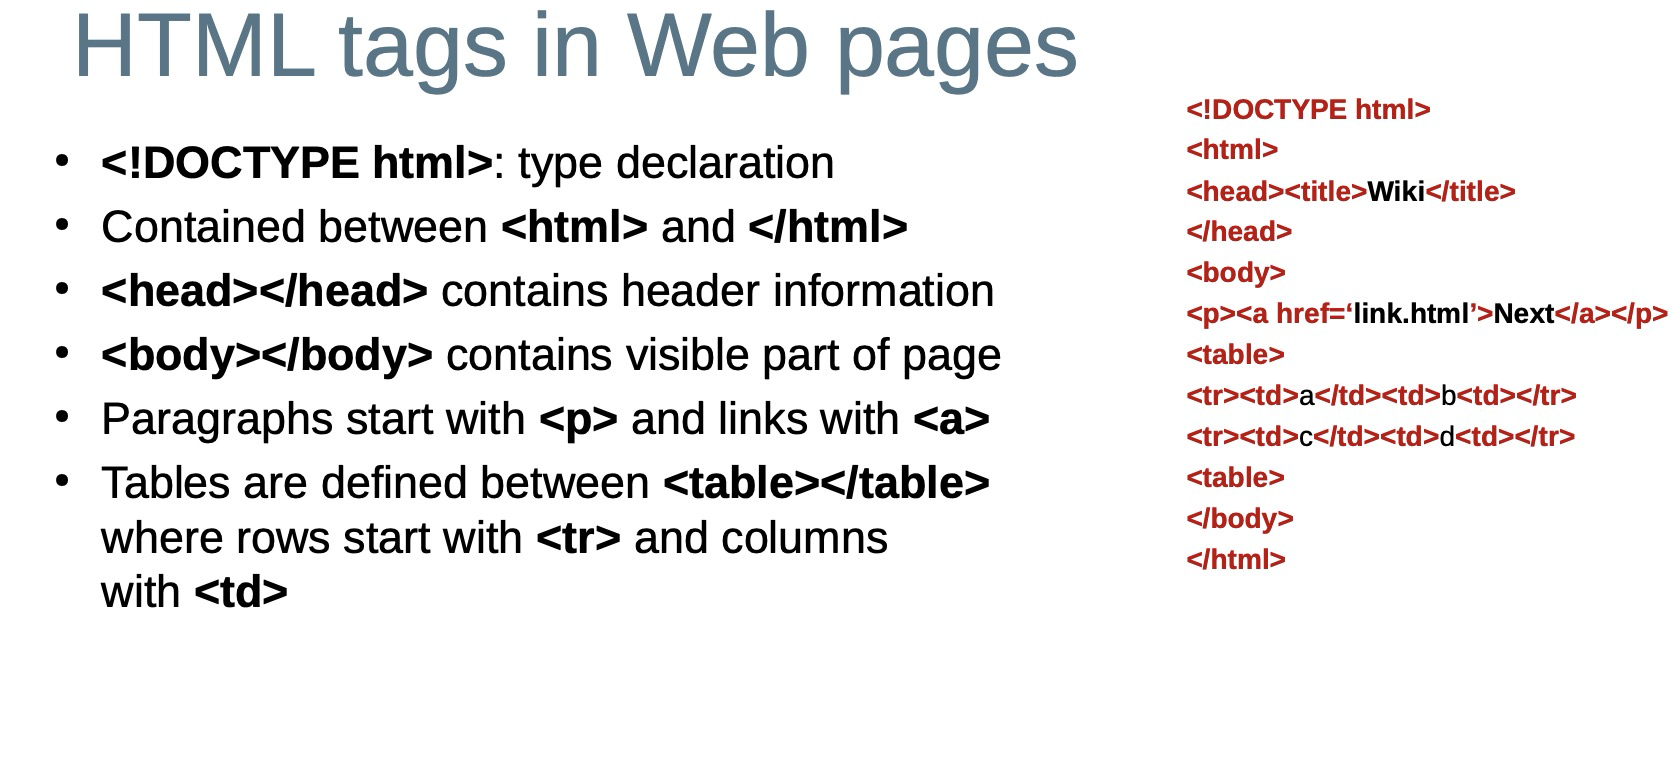
HTML tags in Web pages
Web scraping in Python
Python provides several libraries for scraping Web data
– mechanize, Scrapemark, Scrapy, regular expressions, lxml, BeautifulSoup
BeautifulSoup is a popular module being used for Web scraping, since it is easy and intuitive
– Urllib2 standard Python module can be used in combination with BeautifulSoup for fetching Web pages
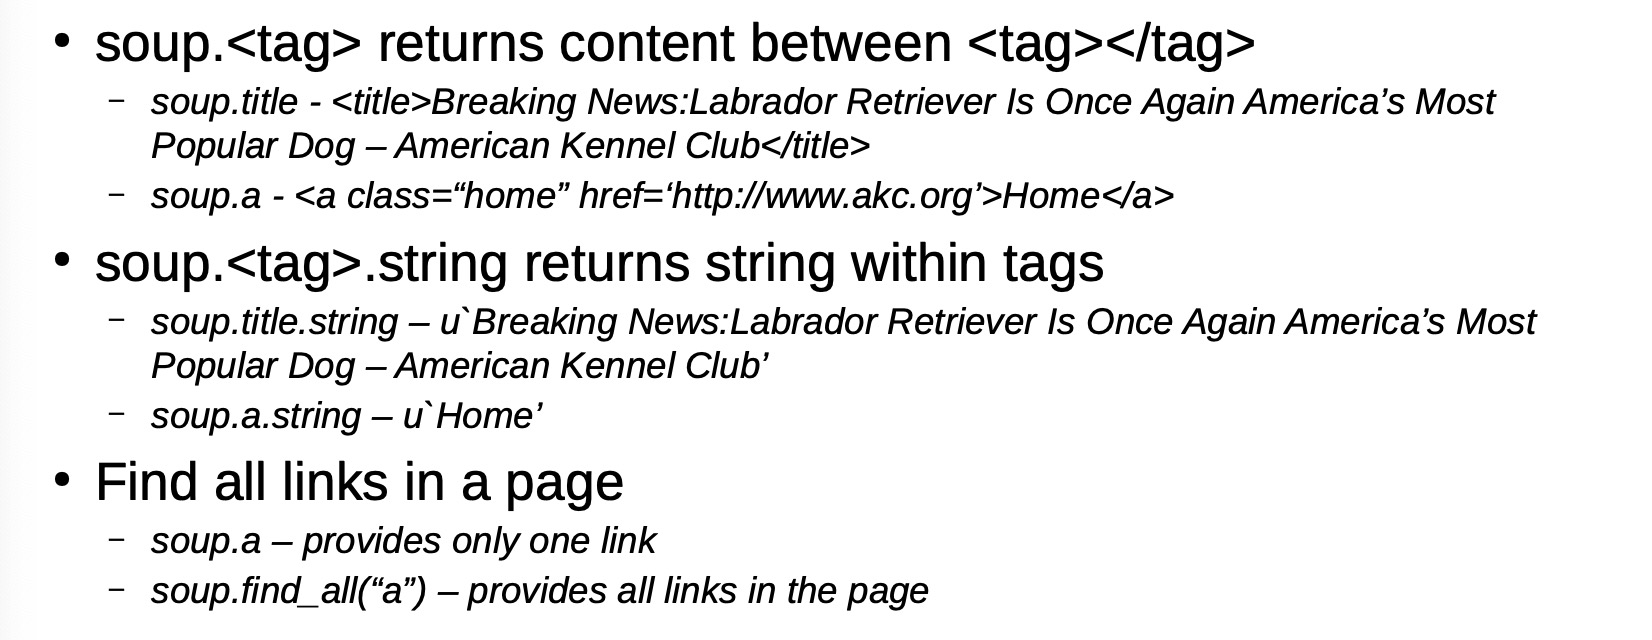
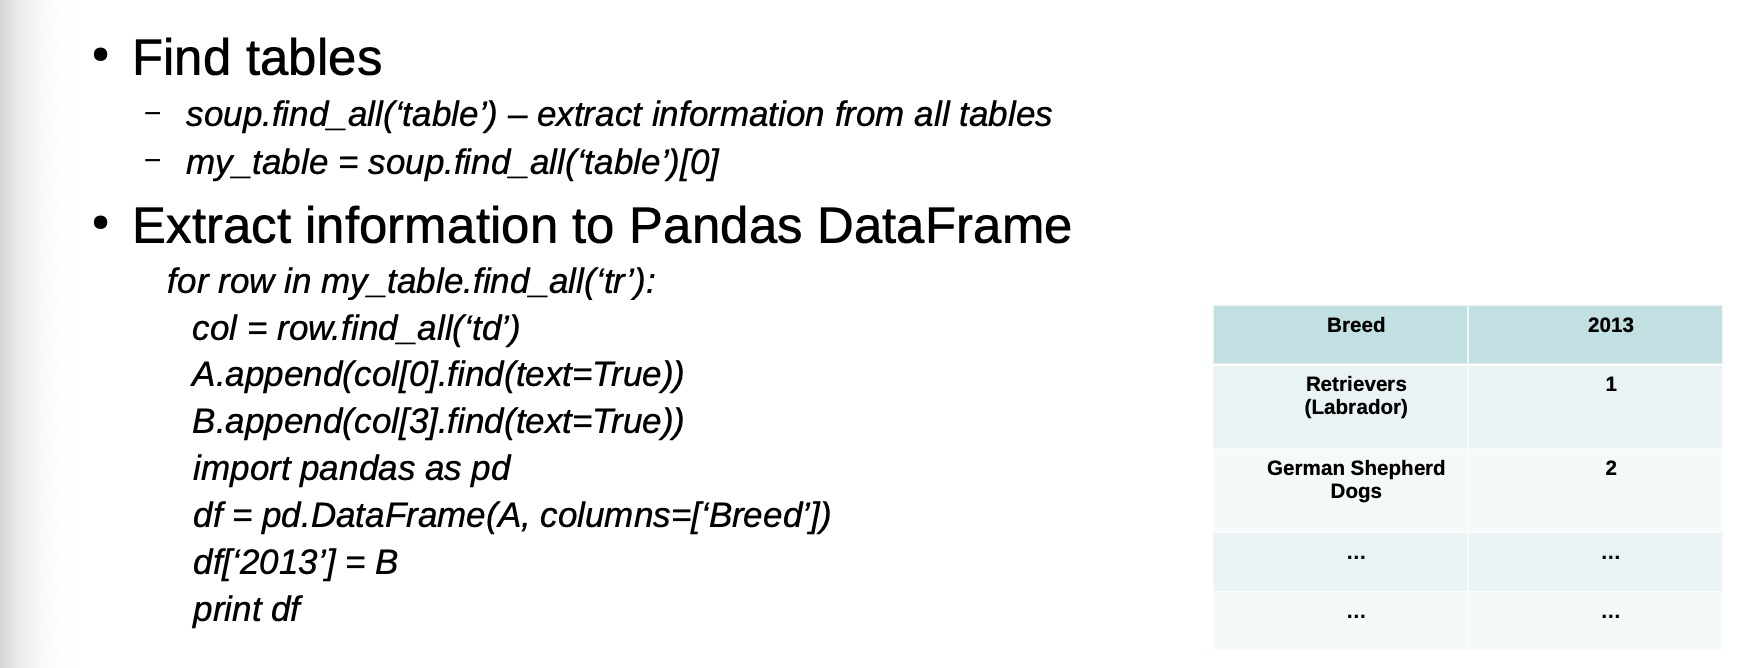
Web scraping using BeautifulSoup 用BS 爬虫
- Import libraries – import urllib2 – from bs4 import BeautifulSoup (https://www.crummy.com/software/BeautifulSoup/)
- Specify the URL of page to be scraped – page = urllib2.urlopen(‘http://www.akc.org/content/news/articles/labradorretriever-is-once-again-americas-most-popular-dog/’) – soup = BeautifulSoup(page)
- Structure of the page – print soup.prettify()
Geocoding of data
- Multi-variate attribute – Unit number, street number, street name, suburb name, state, postcode, country
- – Example: “Unit 20”, “18 North road”, “Acton ACT 2602”
- Exact matching
- – Exact location by one-to-one match
- Fuzzy matching
- – Possible matches (one-to-many) in neighboring region
Forward and reverse geocoding
Geocoding is a two-way process: forward and reverse mapping
- Forward geocoding
- – Transforming address (text) data to geographical coordinates (longitude and latitude)
- Reverse geocoding
- – Transforming geographical coordinates to address data
Data quality
For quality analysis and mining results, data quality is important
Garbage-in garbage-out principle
Data quality assessment
Data quality is specific to context
– High quality data for some applications may not be sufficiently good for other applications
– Often not possible to get data of 100% quality
Scientific and statistical evaluation of data to determine if they are adequate for intended use
Data quality is a multi-dimensional concept 多维度概念
– Both subjective and objective 包括主观评价和客观评价
Data quality dimensions 数据质量维度
Six core dimensions
– Completeness
– no missing data
– Consistency
– across different sources
– Uniqueness
– single view of dataset
– Validity
– meet constraints and rules
– Accuracy
– correct and reflect real data
– Timeliness
– no out-of-date values
Measure Uniqueness
- Completeness 数据完整性:
- Definition:Proportion of available data against 100% complete
- Measure:Percentage of missing values
- Consistency 一致性
- No difference between two or more representations of a record
- Percentage of record representations with the same format Note: Consistency can be both at level of format as well as values 具有相同格式的记录表示的百分比
- Uniqueness 唯一性
- Definition:No duplicate records in a dataset
- Measure:Ratio of number of records in a dataset and number of real entities 数据集中记录数量与真实实体数量的比率
- Validity 可用性
- Definition:Data confirming to the syntax (format, type, range) 格式,类型,范围是否一致
- Measure:Comparison between the data and the metadata 数据和元数据之间比较
- Accuracy 准确性
- Definition: Degree to which data correctly describes the real entity
- Measure: Percentage of accurate representations of entities in a data set, where this can often not be ascertained with only a data set itself. 数据集中实体的精确表示的百分比,这通常不能仅用数据集本身来确定。
- Timeliness 时效性
- Definition:Degree to which data represent a real entity in a point in time
- Measure:Percentage of records with up-to-date values (where up-to-date can be application dependent) 具有最新值的记录的百分比(其中最新值可能取决于应用程序)
- Other dimensions
- Usability
- relevant and accessible
- Understandability
- easy to comprehend
- Flexibility
- compatible and easy to manipulate
- Volume
- appropriate amount of data for the application
- Privacy / confidence
- data protection and security
- Value – cost/benefit of data
Data profiling数据概要分析
Examining, exploring, and collecting statistics and information
about data
• To determine the metadata about a data set
- Metadata is data about a data set 元数据是关于数据集的数据
Data profiling provides insights and allows identifying
data quality requirements
– For more thorough data quality assessment
– A process of discovery
Data profiling versus data mining 数据概要分析和数据挖掘
Data profiling
– Goal: discovers information and metadata
– Input: raw data
– Output: information about attributes (columns)
Data mining / analytics
– Goal: discovers interesting knowledge and patterns
– Input: pre-processed and cleaned data
– Output: information about records (rows)
Single versus multiple column profiling
• Single column
– Basic statistics of a single column
– Discover common properties and statistics of a single attribute that are assumed to be of same type – Complexity: Number of rows
• Multiple column
– Discover joint properties, dependencies and correlations, and statistics of multiple attributes
– Complexity: Number of columns * Number of rows
Statistics (single column)
- Number of unique (distinct) values
- Number of missing values
- Minimum and maximum values
- Average (mean) and median
- Quartiles (25%, 75%)
- Variance and standard deviation
Benford’s law
First digit law
– Distribution of first digits in natural numbers
– Digit 1 occurs in about 30% (much greater than uniform distribution of 11.1% for each of the 9 digits) – Digit 9 only occurs in about 5%
– Occurs in street numbers, stock prices, death rates, etc.
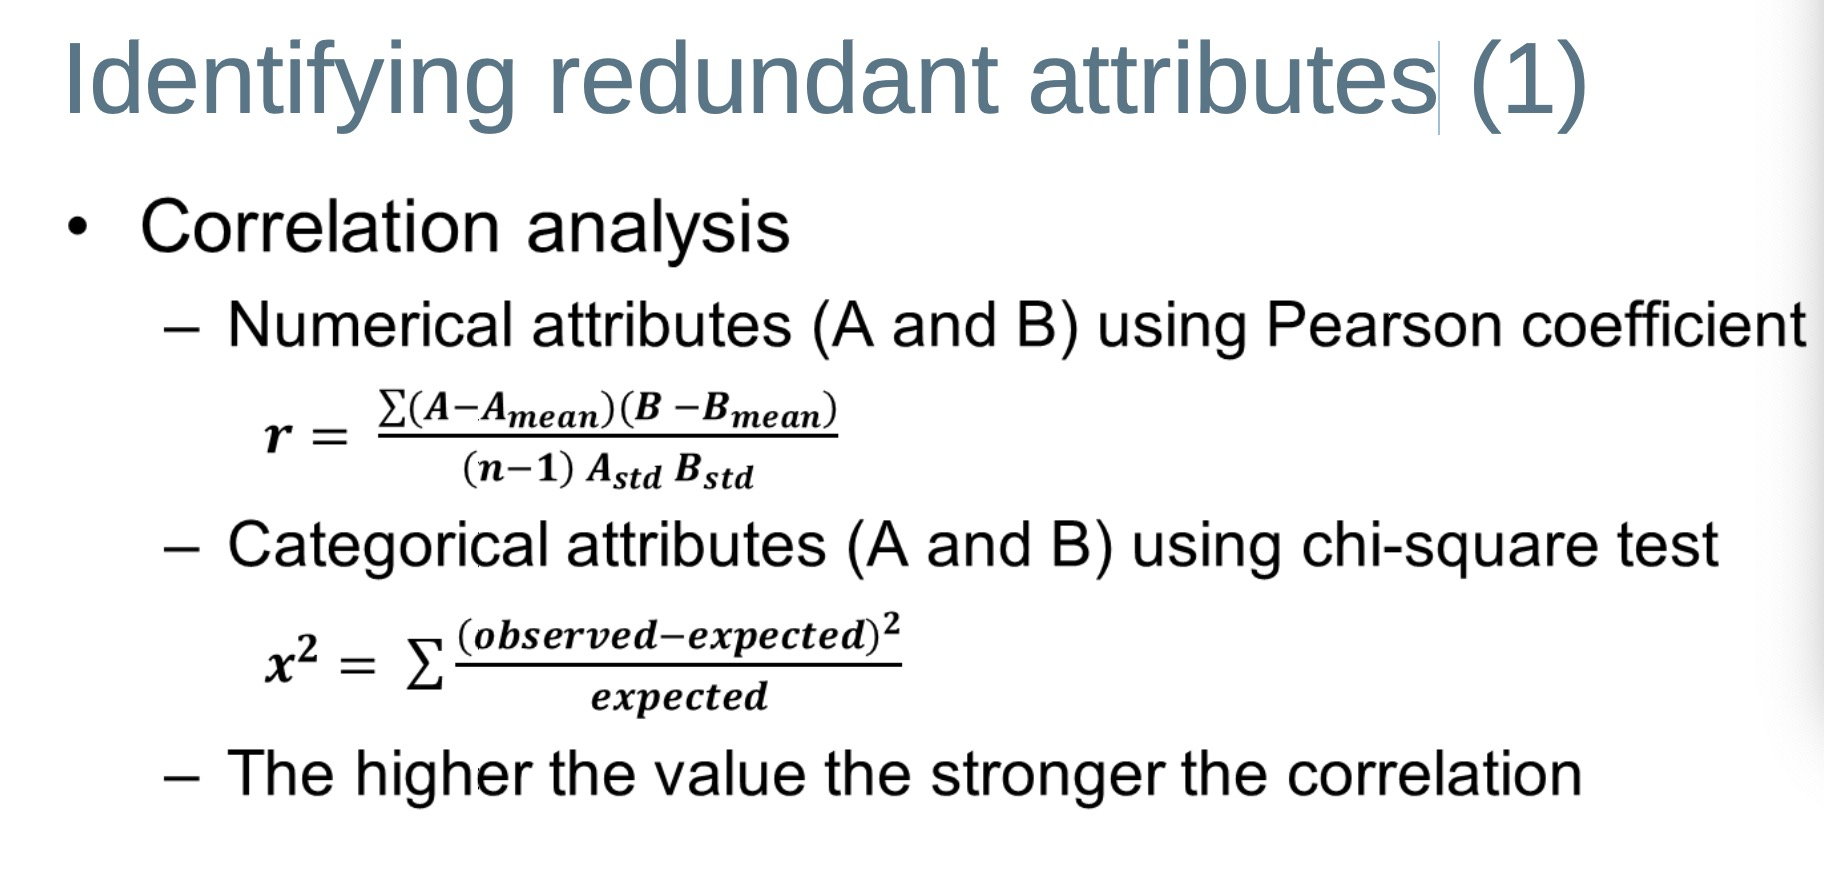
Dependencies 相关性
- Dependencies / correlations between attributes – Example: employment and income, age and weight 就业和收入、年龄和体重 两个变量(属性)具有线性或 彼此之间的非线性关系
- The extent to which two variables (attributes) have a linear or non-linear relationship with each other
- Several correlation coefficients, including the Pearson coefficient, can be used to measure the correlation and dependency between attributes
Data visualisation
- Bar plots
- Box plots
- Scatter plots
- Line plots
Data profiling tools
- Various commercial software:
- – IBM InfoSphere Information Analyzer, Oracle Enterprise Data Quality, SAP, Informatica Data Explorer, Trillium Software Data Profiling, Microsoft SQL Server Integration Services Data Profiling Task and Viewer
- Open source software:
- Rattle (based on R programming language)
- Python modules such as Pandas
Data profiling with Python
Data exploration using pandas
import pandas as pd
df = pd.read_csv(“weather.csv”)
- First 10 rows 首10行
df.head(10)
- Summary of numerical attributes 该书
df.describe()
- Frequency table for categorical attributes 出现数量统计
df[‘WindDir3pm’].value_counts()
- Data distributions
df[‘MaxTemp’].hist(bins=50)
df.boxplot(column=‘MaxTemp’)
df.boxplot(column=‘MaxTemp’, by=‘Location’)
- Check missing values
df.apply(lambda x: sum(x.isnull()),axis=0)
- Cross tab 交叉选项卡
ct = pd.crosstab(df[‘WindDir9am’], df[‘RainToday’])
ct.plot(kind=’bar’, stacked=True, color=[‘red’,’blue’], grid=False)
Data quality issues 数据质量问题
Various causes of data errors:
– Data entry errors / subjective judgment
– Limited (computing) resources
– Security / accessibility trade-off
– Complex data, adaptive data
– Volume of data
– Redundant data
– Multiple sources / distributed heterogeneous systems
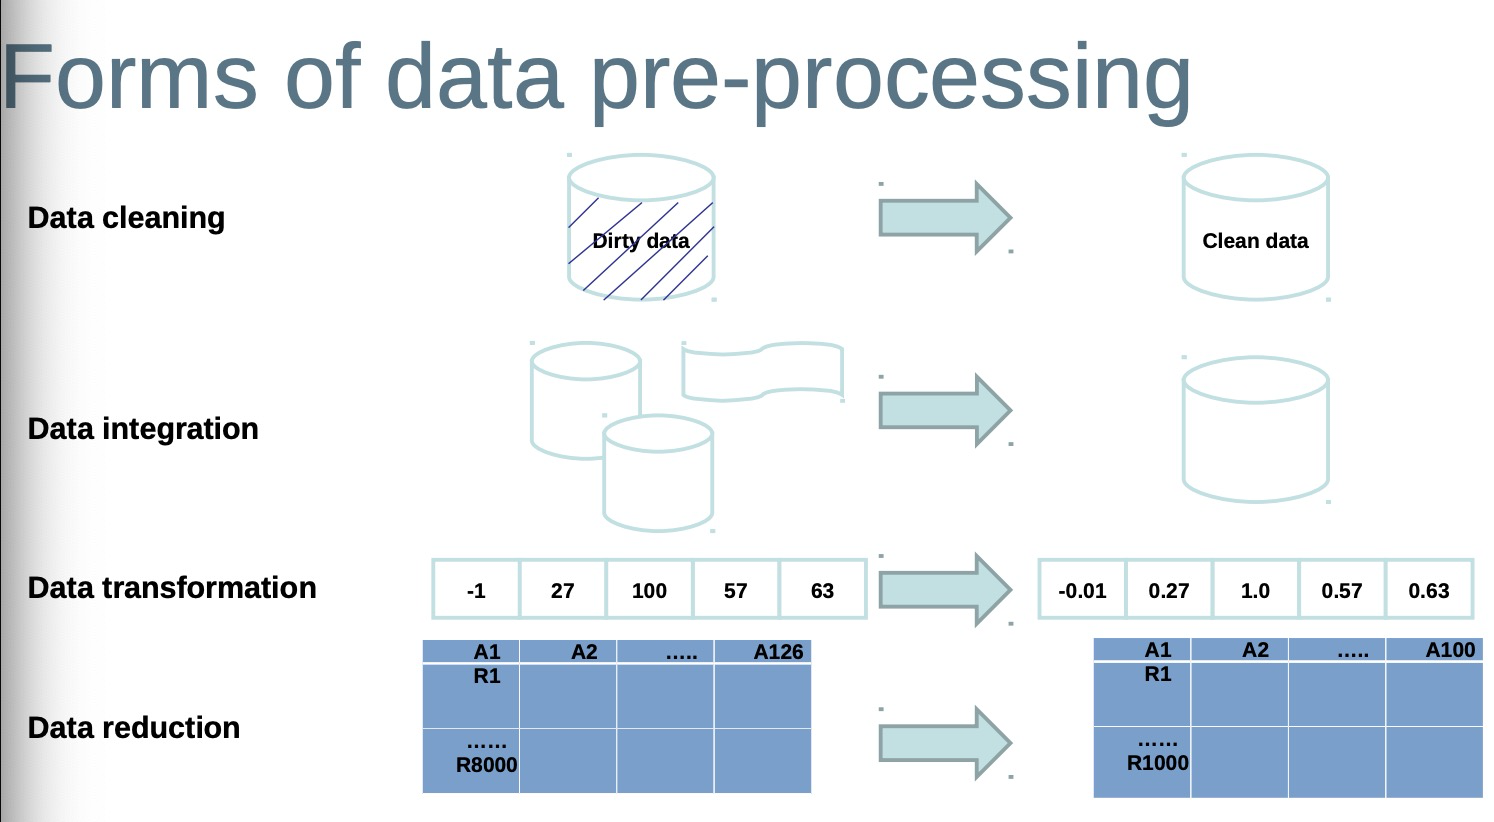
Data cleanning
A highly crucial data pre-processing step
Includes various tasks:
– Dealing with missing data
– Handling outliers and noisy data
– Removing redundant and duplicate data
– Resolving inconsistencies
Missing data
Absence of attribute values due to various reasons
– Equipment malfunction
– Not entered due to misunderstanding
– Not considered important during data entry
– Deleted due to inconsistency with other values
Impute missing data
- Manual imputation 人工插补
– Time consuming and infeasible
- Automatic imputation
– Global constant (for example, N/A) 全局常熟
– Mean attribute value 平均属性值
– Mean value of all records belonging to the same class 属于同一类别的所有记录的平均值
– Inference-based (for example, Bayesian or decision tree) 基于推理(例如,贝叶斯或决策树)
– use data mining and machine learning to predict most likely values to impute 使用数据 挖掘和机器学习来预测最有可能估算的值
Outliers and noisy data
- Random error or variance in the data
- Incorrect values and errors occur due to
– Faulty data collection instruments
– Data entry problems
– Data transmission problems
– Technology limitation
– Misunderstanding of required data
- Depending upon application outliers are important
– For example fraud detection or national security
Smooth noisy data
Binning
– Sort data and partition into equal-frequency bins 对数据进行分类,并划分到等频率的箱中
– Smooth by bin means, bin median, bin boundaries 通过箱手段、箱中间值、箱边界平滑
- Regression
– Smooth by fitting data to regression functions
- Clustering
– Identify outliers not belonging to clusters
- Manual inspection (active learning) of possible outliers
Redundant data 冗余数据
Duplicate records occur within a single data source 重复记录出现在单个数据源中,or when combining multiple sources 或者多个数据源聚合后
– The same entity/object might have different values in an attribute 同一个对象可能会有不同的数值
– One attribute may be a derived attribute in another database 一个属性可能是另一个数据库中的派生属性
– Attribute values of the same object entered in different time 同一对象在不同时间输入的属性值
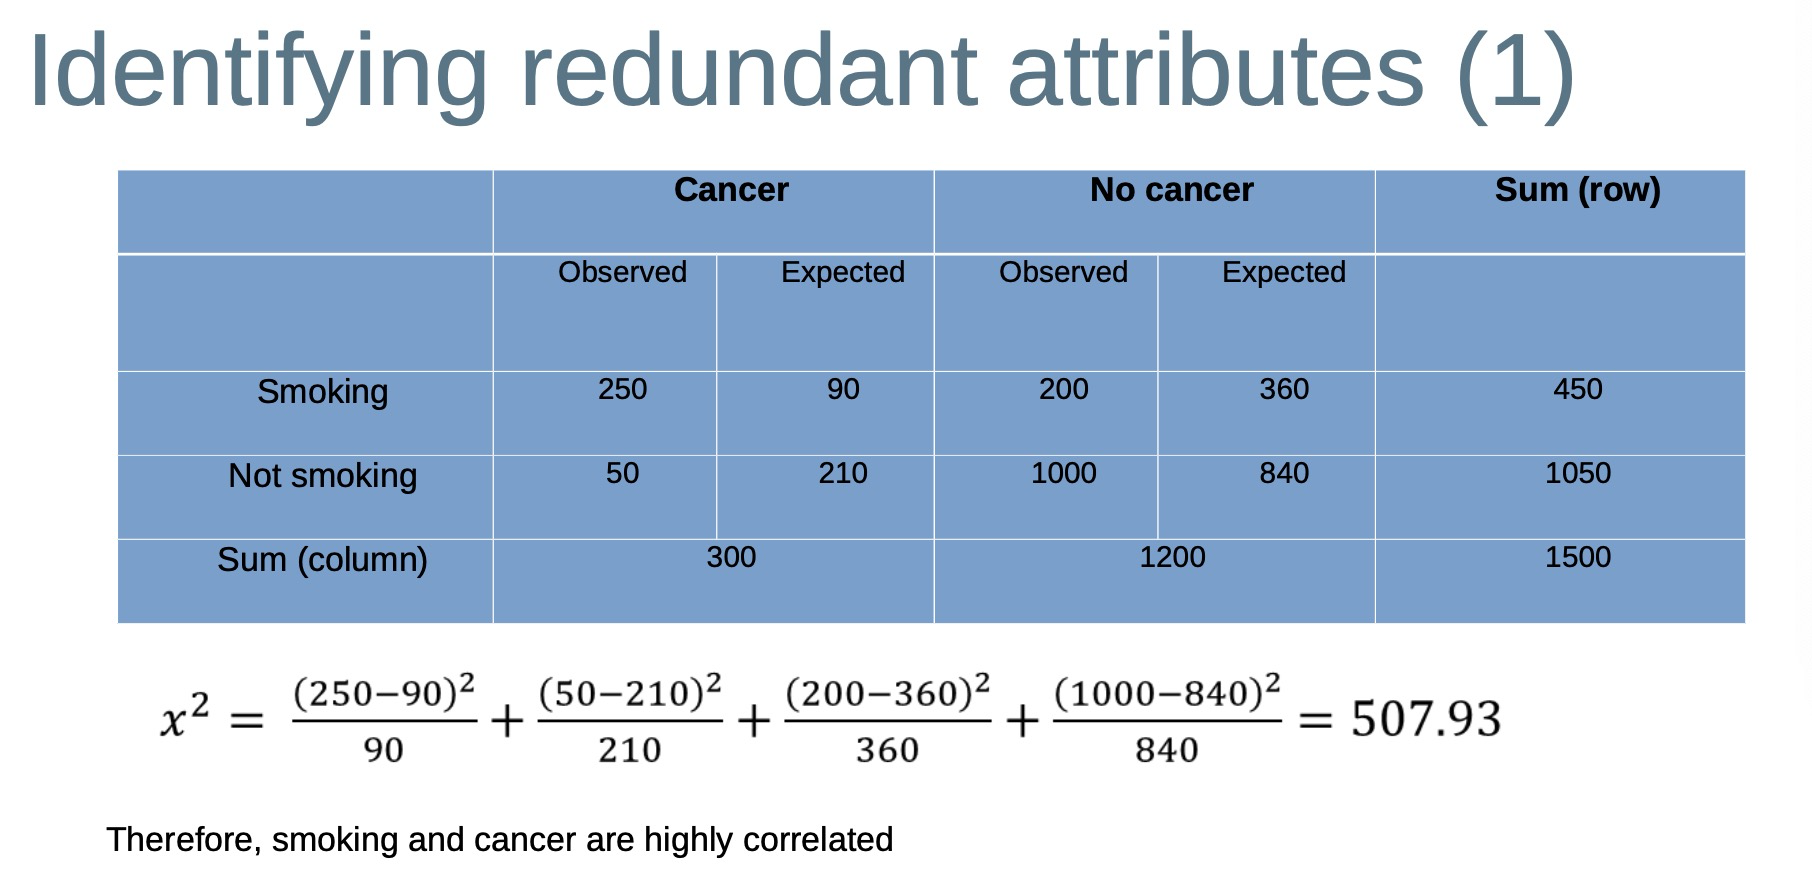
- Redundant attributes can be identified by correlation analysis 可以通过相关性来分析
- Redundant records can be identified by deduplication or data integration (more about this later in the course) 可以通过重复数据删除或数据来识别 集成(本课程稍后将详细介绍)
Identifying redundant attributes
Inconsistent data
Different formats, codes, and standards across different sources
(even within a single source)
- Resolving using external reference data
– Lookup tables
- E.g. Sydney, NSW, 7000 -> Sydney, NSW, 2000
– Rules
- Male or 0 -> M
- Female or 1 -> F

若有收获,就点个赞吧
0 人点赞
