- Data transformation
- Generalisation
- Normalisation
- Attribute/feature construction
- Data aggregation
- data reduction
Data transformation
- Generalisation 归纳
Using concept hierarchy 使用概念层次结构
- Normalisation 标准化
Scale data to fall within a small (specified) range 缩放到某个小的特定的范围区间
Min-max normalisation, z-score normalisation, decimal scaling, logarithm transformation 最小-最大归一化、z分数归一化、十进制缩放、对数变换
- Attribute/feature construction 属性/特征构造
New attributes constructed by applying a function on existing attributes 通过现有属性构造新属性
Generalisation
Based on concept hierarchy or value generalisation hierarchy Concept hierarchy 基于概念层次或价值层次
Concept generalisation hierarchy 基于概念层次
– specifies ordering of attributes explicitly at the schema level (as discussed in the data warehousing lecture)
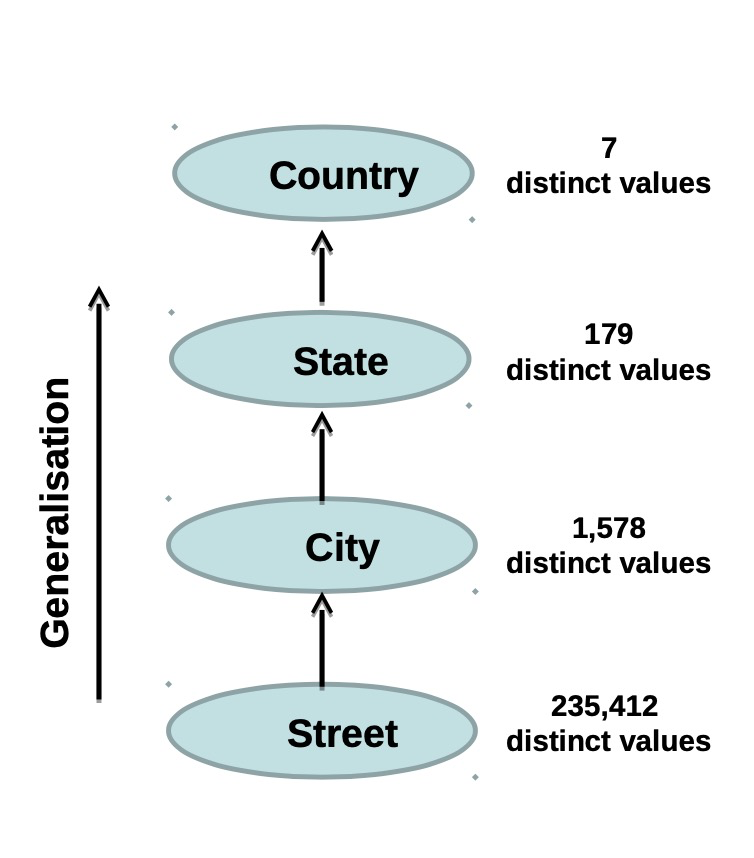
For example, Street < City < State < Country
Value generalisation hierarchy 基于价值层次
– specifies a hierarchy for the values of an attribute by explicit data grouping
For example, {Dickson, Lyneham, Watson} < Canberra
Some concept hierarchies can be automatically generated
- Based on the number of distinct values in each attribute
- The attribute with the most distinct values is in the lowest level of the hierarchy
Day, month, year and time attributes are exception!
Normalisation
Min-max [0-1] normalisation 最大最小归一化
—— Subtracting the minimum value and dividing by the difference between maximum and minimum values 减去最小值,除以最大值和最小值之间的差值
- Z-score normalisation Z分数归一化
—— Subtracting the mean value and dividing by the standard deviation 减去平均值除以标准偏差 - Robust normalisation
—— Subtracting the median value and dividing by the median absolute deviation 减去中间值并除以中间绝对偏差
- Logarithm normalisation 对数标准化
- For attributes with skewed(偏斜) distribution (such as income)
- Transforms a broad range of numeric values to a narrower range of numeric values 将大范围数值转换为小范围数值
- Useful when data have outliers with extremely large variance 当数据有利群点和极大方差时很有用
- For example, using a base 10 logarithm function, a list of income values [$10,000, $100,000, $150,000, $1,000,000] is transformed into [4, 5, 5.18, 6]
Attribute / feature selection 属性、特征选择
- Reduce the number of features/attributes that are not significant for a certain data science project 减少某个对项目不重要的特征值
- Select a minimum set of features/attributes such that:
- The probability of different classes or information gain given the values for these features is as close as possible given all the features 尽可能找到小的特征合集,可以涵盖所有信息。
- Exponential number of choices 指数数量的选择
- 2d possible combinations of sub-features from d features 来自d特征的子特征的2的d次方可能组合
Select Method
- Step-wise forward selection
- Best feature is selected first, then the next best feature condition to the first is selected, and so on 依次挑选最好的特征
- Step-wise backward elimination
- repeatedly eliminate the least useful feature 反复删除最没有用的特征
- Combining forward selection and backward elimination 结合前两者
- Repeatedly select best and eliminate worst features
- Decision-tree induction (machine learning-based) 决策树推导方法
Attribute / feature construction 特征构造
- A process of adding derived features 派生属性 to data (also known as constructive induction or attribute discovery) 向数据添加派生特征的过程(也称为构造归纳或属性发现)
- Construct new attributes/features based on existing attributes/features 基于现有特征构造新特征
- Combining or splitting existing raw attributes into new one which have a higher predictive power 结合或者分离原始数据,形成新的有预测能力的数据。
- For example splitting date attribute into month and year attributes for monthly and annual processing
- Generating new attribute on tax exclusive price values
Data aggregation 数据聚合
- Compiling and summarising data to prepare new aggregated data
- The aim is to get more information about particular groups based on specific attributes, such as age, income, and location
- For example, aggregated phone usage of customers by age and location in a phone calling list data set
- Can also be aggregated from multiple sources
Data reduction 数据整理
- Volume of data increases with the Big data growth
- A process of reducing data volume by choosing smaller forms of representation 减少数据量,选择更小的方式表示
- Parametric methods: 参数方法
- Construct model fitting the data, estimate model parameters, store only the parameters, and discard data 构建拟合模型,预测模型等
- Non-parametric methods: 非参数方法
- Based on histograms, clustering, and sampling 基于直方图,聚类,采样
Parametric methods 参数方法
- Linear regression 线性回归: fit the data to a straight line (Y=wX+b), the regression coefficients w and b determine the line using the data
- Multiple regression: to transform to non-linear functions (Y=b0+b1X1+b2X2)
- Log-linear models 对数线性模型: approximate discrete multi-dimensional probability distributions
Histograms 直方图
- Binning:
- Divides data into buckets and store summary for each bucket (total, average, median) 把数据分给各个字段,并单独计算数据特征
- Binning methods:
- Equal width – with equal bin range 等宽、深度bin
- Equal frequency/depth – with equal bin frequency (same number of data points in each bin)
Clustering
- Clustering
- Partition/group data into clusters based on similarity, and store only cluster representation (for example, centroid and diameter only) 按相似度将数据分组,只储存聚类特征
- Clusterting techniques
- Centroid-based - K-means: assigns data to the nearest cluster center (of k clusters), such that the squared distances from the center are minimised 基于中心和距离的巨雷
- Connectivity-based - Hierarchical clustering: data belong to a child cluster also belong to the parent cluster 连接性聚类
- Density-based – DBSCAN: Clusters data that satisfy a density criterion 基于密度的聚类
- Distribution-based – Gaussian mixture models: Models (iteratively optimized) data with a fixed number of Gaussian distributions 基于分布和模型的聚类
Sampling 采样
- Sampling
- Generate a small sample to represent the whole dataset 生成一个小样本集来表示整个数据集
- Choose a representative subset of the data Sampling methods:
- Simple random sampling does not perform well on skewed data (for example, only a few people with high salary) 简单的随机抽样,但是在倾斜数据集上表现不好。
- Stratified sampling is an adaptive sampling method that divides the data into groups (known as strata) and a probability sample is drawn from each group
分层抽样是一种自适应抽样方法,它将数据分成组(称为地层),并从每组中抽取一个概率样本
Lec 8
Data types
Common data types include
- String data (such as first name) Numerical data
- Continuous (such as electricity price)
- Discrete (such as age)
- Categorical data (such as marital status)
- Ordinal data (such as movie rating)
- Binary data (such as smoking)
Free-text data (such as clinical notes)
<br />Other (complex) data types include
Data / time data (such as date of birth)
- Geographical data (such as location)
- Web data (such as HTML table)
- Image data (such as scanned receipt)
- Audio data (such as recordings or songs)
- Video data (such as Youtube video)
- Multi-variate data (such as address)
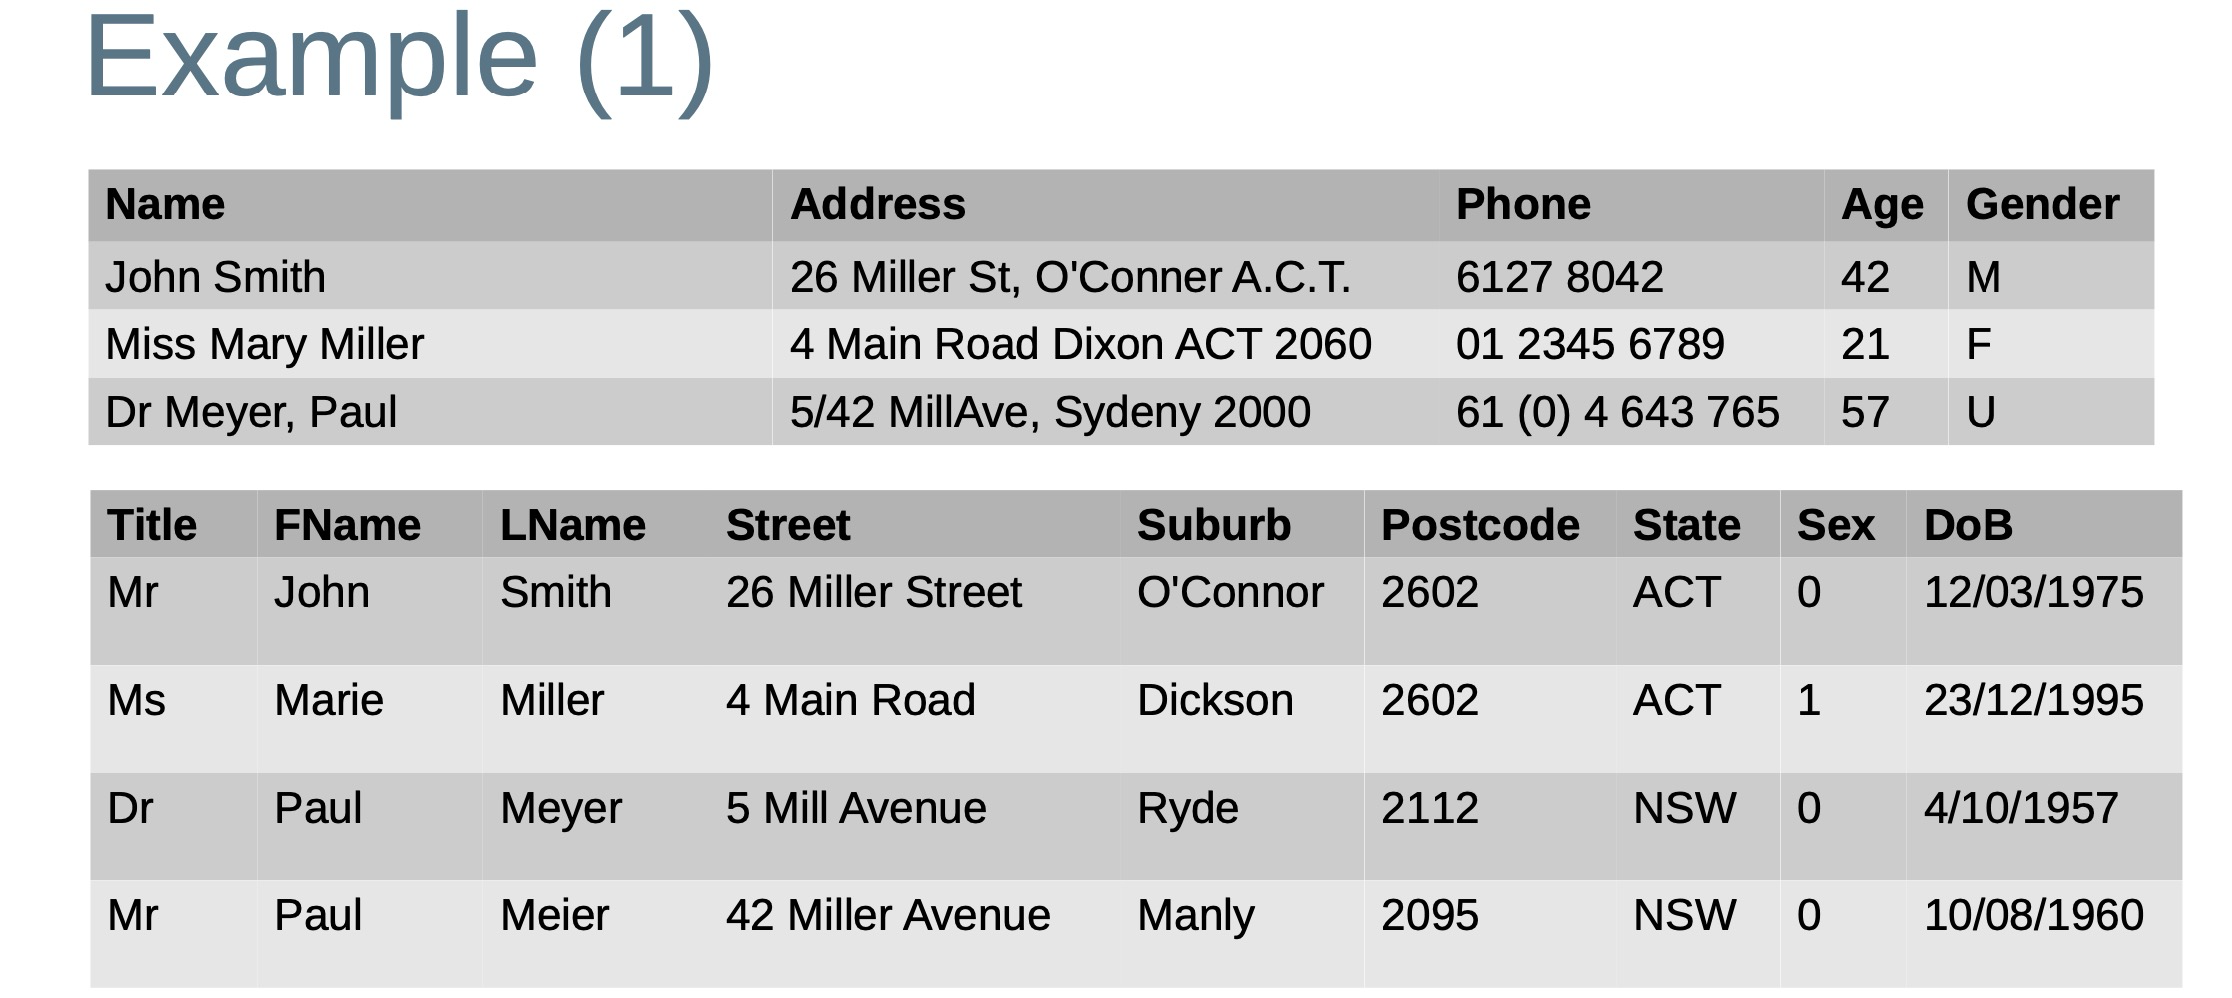
Processing multi-variate attribute
- Multi-variate attributes contain values of multiple elements (features) in a single attribute
- Examples: address, name, date and time of entry, telephone number
- Several steps for pre-processing such attributes:
- Parsing ——> Validating ——> Correction ——> standardisation
Aim of pre-preocessing such attributes
- Segment into well defined fields
- Remove unwanted characters and words
- Remove punctuations and stop words
- Correct misspellings
- Verify if values are possible individually and in combination
- Standardise values
- Expand abbreviations
- Replace nicknames
- Convert into consistent upper/lower case
- Multi-variate attributes are a special type of data
- Data parsing and standardisation is required to pre-process such attributes for improved data integration and analytics
Example applications include:
- Parse, standardise and validate mailing addresses of customers (for marketing)
- Parse and standardise free-form text data elements (for example, customer reviews and opinions)
Standardise, validate, enhance, and enrich customer data
Data parsing
<br />Placement of various data elements into the appropriate fields 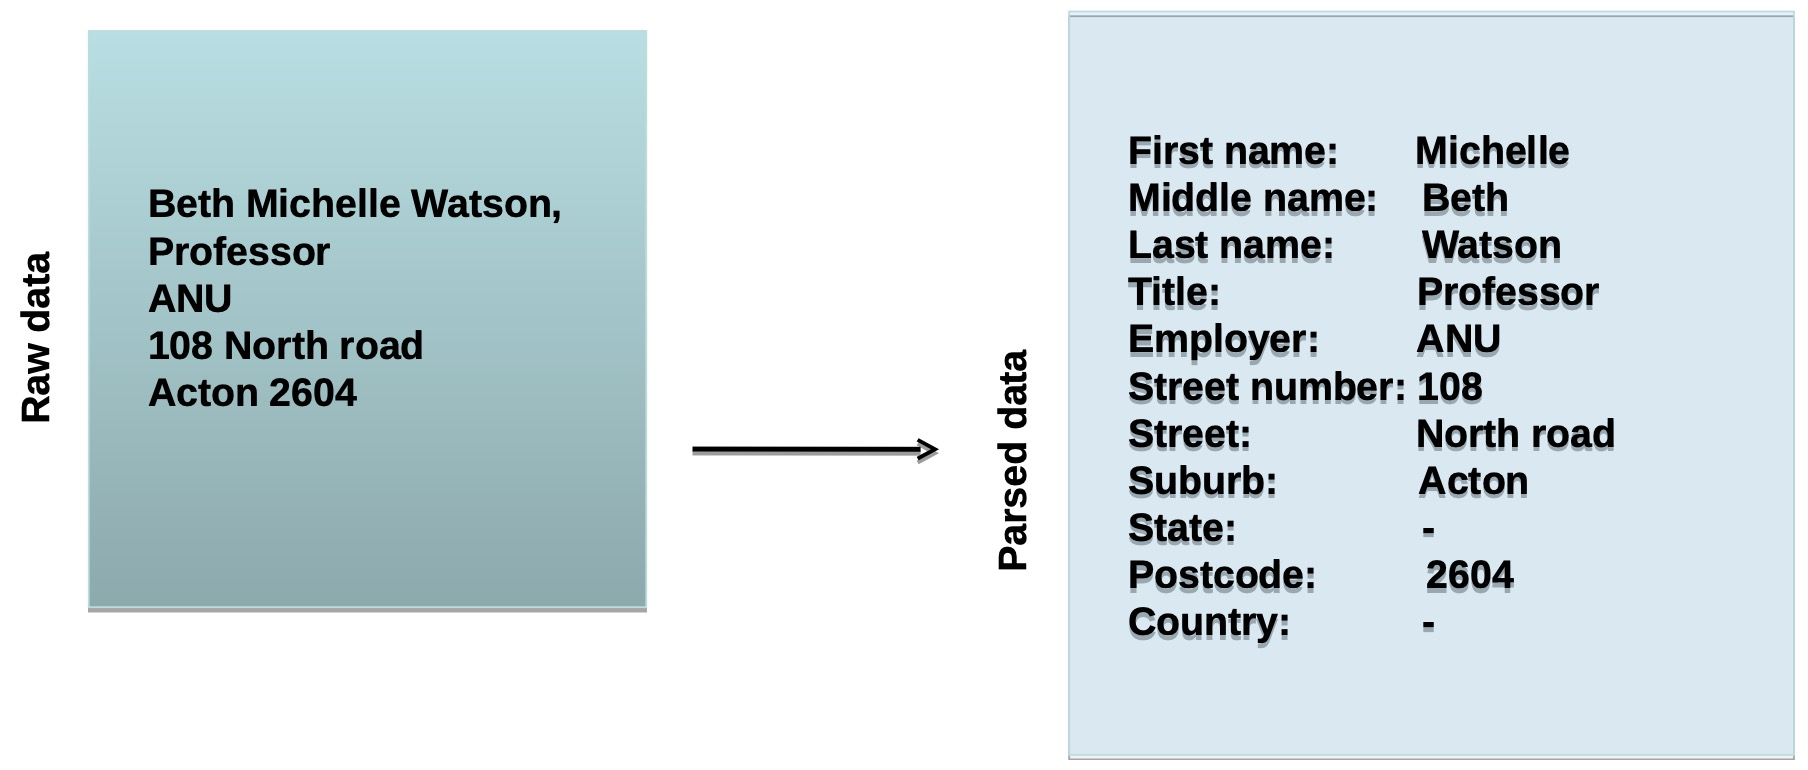
Data validation 数据有效性
- Once parsed, every field in every record needs to be audited for content 解析后,每条记录中的每个字段都需要审核内容
- An essential, but often overlooked step
- Identify records with no data, garbage data (punctuation signs and symbols) and inappropriate data 识别没有数据、垃圾数据(标点符号和符号)和不适当数据的记录
- For example, Australian postcodes should contain 4 numeric characters 例如,澳大利亚的邮政编码应该包含4个数字字符
- Incorrect postcode for a given suburb/town name.给定郊区/城镇名称的邮政编码不正确
- Missing state/territory and country
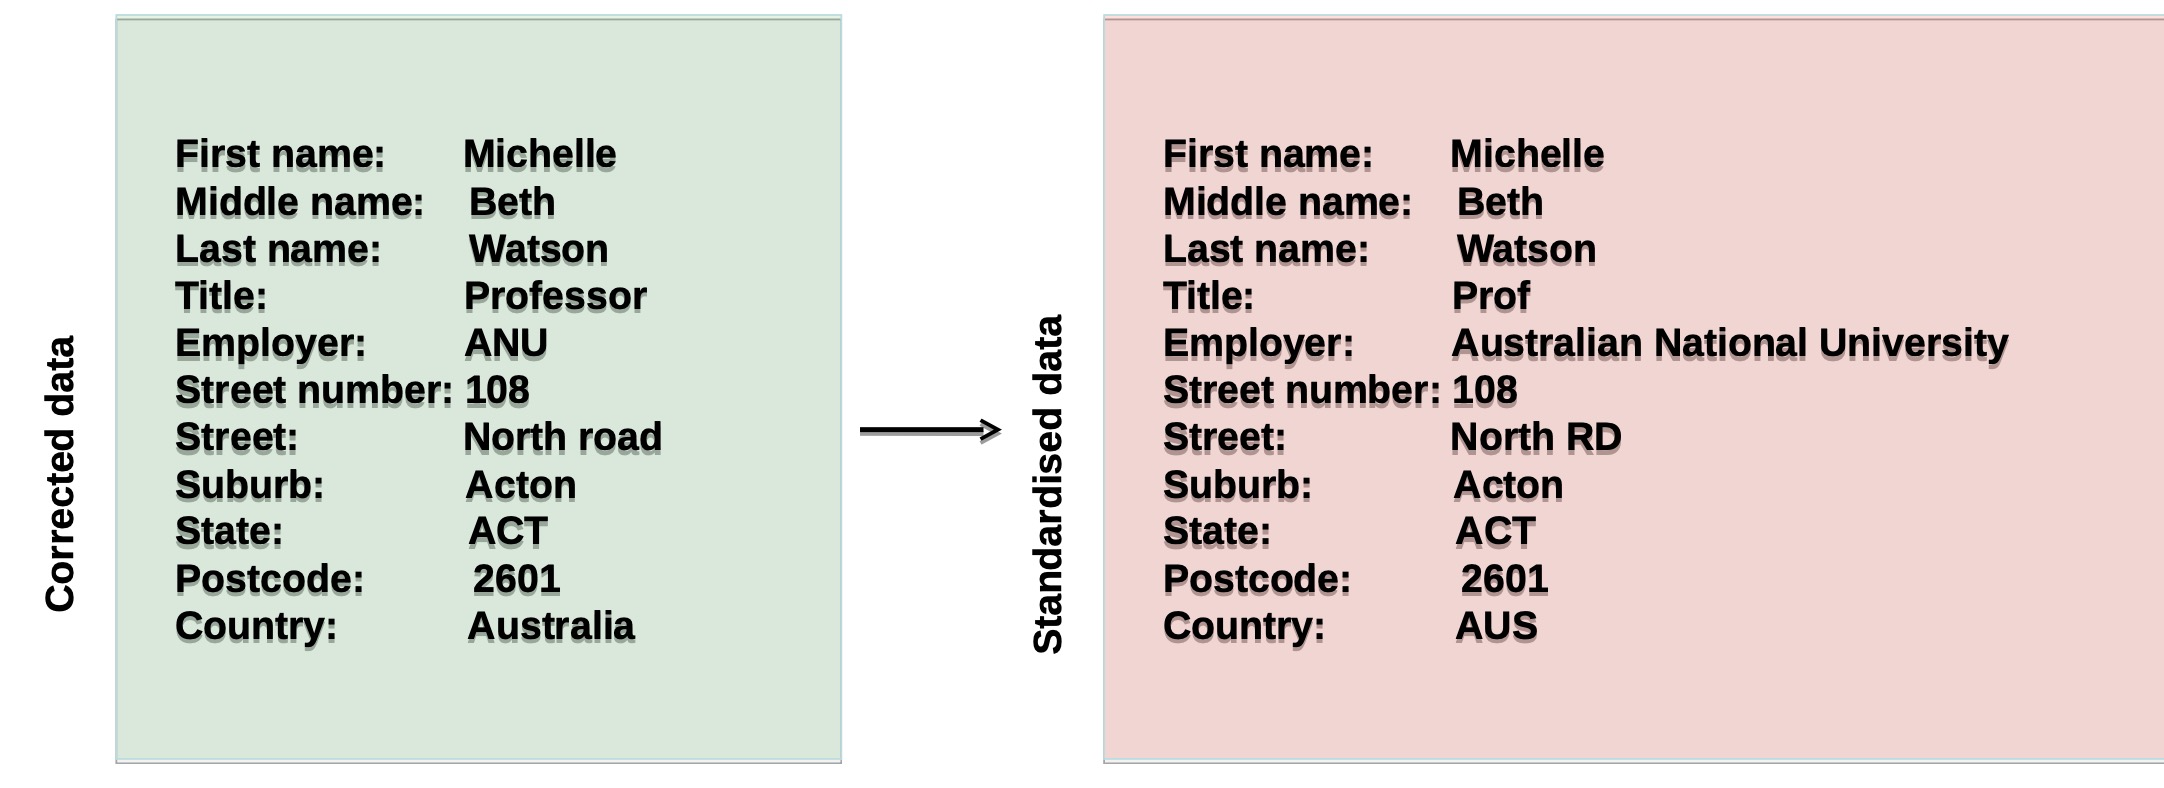
Data standardisation
- Once data have been corrected, the elements are standardised according to the criteria given
- To further clean data by making them consistent Employment of standards for elements
- For example, street, st, and str are standardied as ST; road and rd are as RD; title Professor as Prof; country in 3 letters (Australia as AUS); state Australian Capital territory as ACT; or the employer name without abbreviation (ANU → Australian National University), etc.
Segmentation methods
- Parsing data requires segmenting values into separate elements
- Several methods for segmentation:
- Rule-based: Manually developed or machine learning-based (using training data) rules for segmentation
- Pattern matching languages: Regular expressions, for example, search for particular signatures in data for segmentation
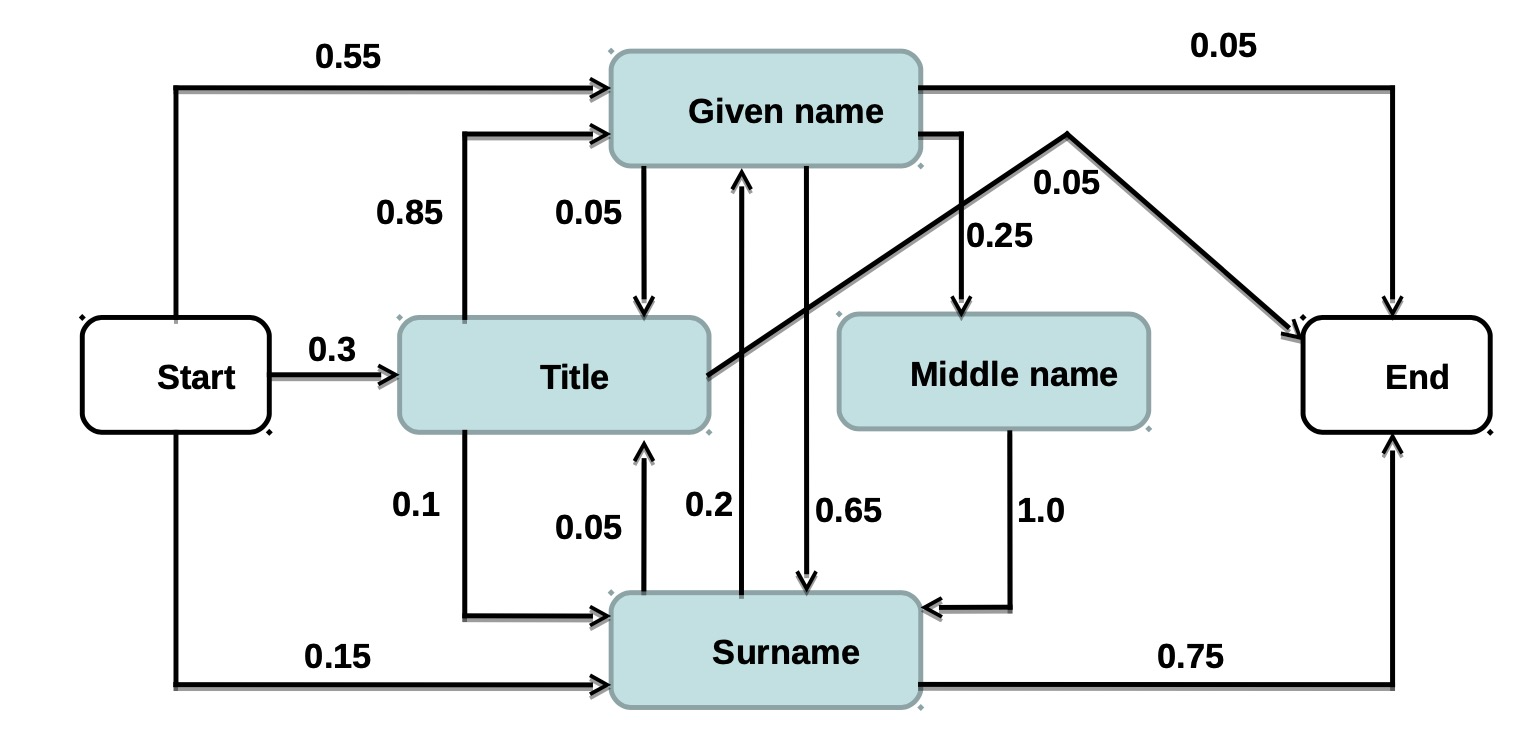
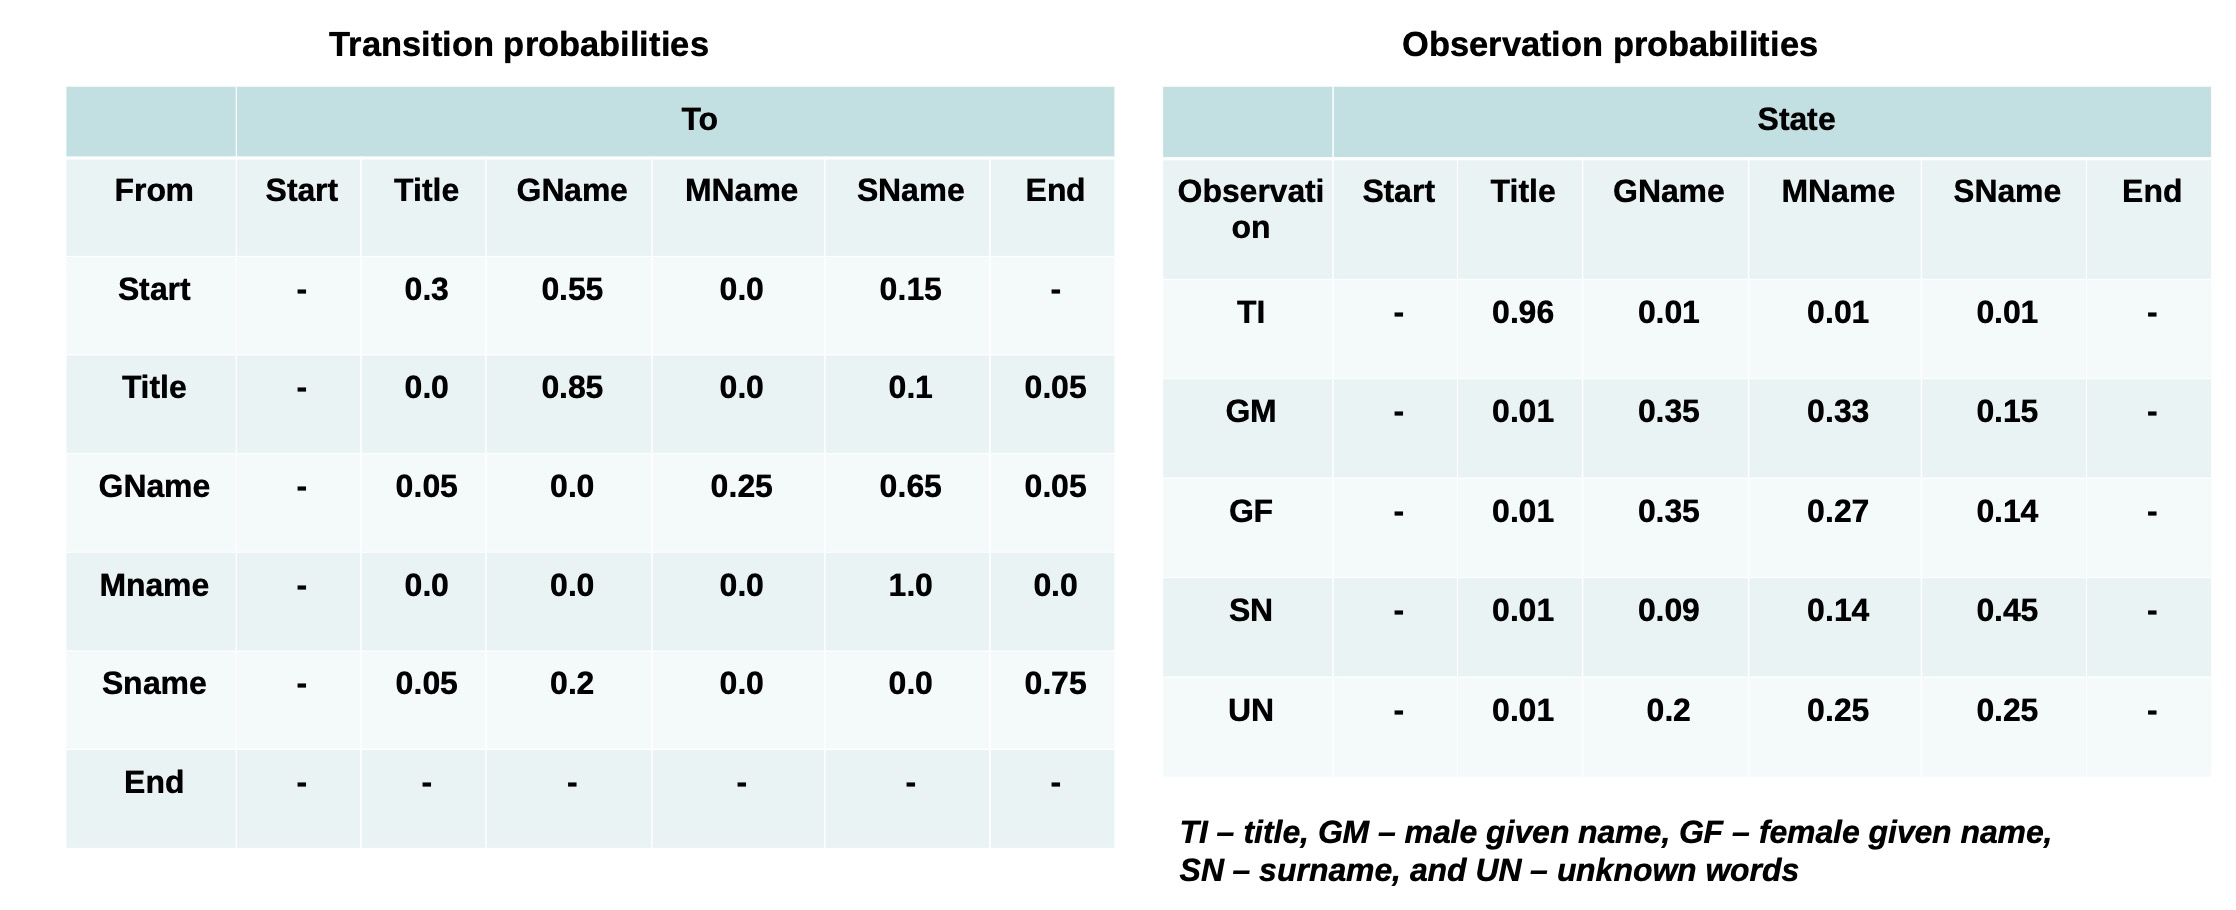
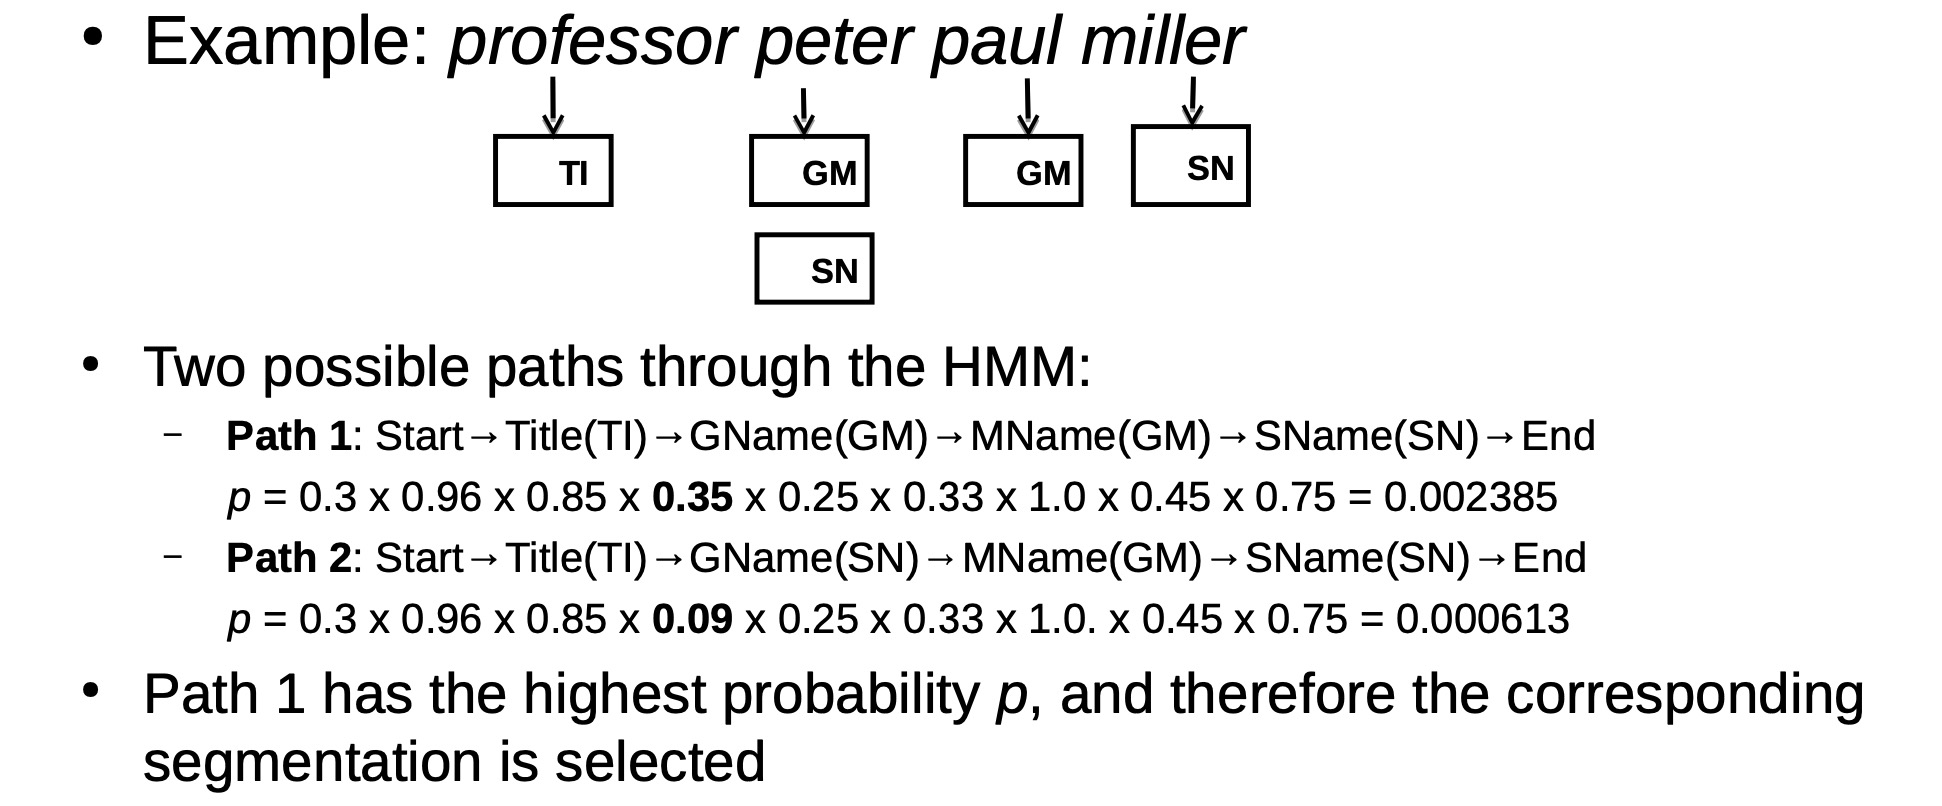
- Probabilistic methods: Hidden Markov models (HMM) and variations have been used for text segmentation in speech and natural language processing
- A probabilistic finite state machine that consists of
- A set of hidden states
- Transition edges between these states
- A finite dictionary of discrete observation symbols
- Transition probability: Each edge is associated with a transition probability (which sum to 1.0 for a given state)
- Observation probability: Each state emits observation symbols from the dictionary with a certain probability (which also sum to 1.0 for a given state)
- A probabilistic finite state machine that consists of
An example HMM fornames:
• Starts with a given name with probability 0.55
• Followed by surname with probability 0.65 and by a middle name with probability 0.25
Lec 9

Data pre-processing tools
- Various tools available:
- OpenRefine - Open source Google code project for working with messy data (http://openrefine.org/))
- Drake – Open source text-based data workflow tool where steps are defined along with their inputs and outputs (https://github.com/Factual/drake))
- Data cleaner – Profiling, duplicate detection, and cleansing commercial software (http://datacleaner.org/))
- WinPure cleaning tool – powerful commercial tool (http://www.winpure.com/article-datacleaningtool.html))
- Rattle – Open source, built on R for cleaning data
- Python and Pandas – Open source, allows efficient data cleaning
Data pre-processing with Rattle
<br />R is a powerful language for performing data wrangling, analysis and mining <br /> <br />Rattle provides a GUI for such tasks <br /> <br />The typical workflow is:<br />– Loading dataset<br />– Exploring dataset<br />– Transforming and cleaning dataset – Building models <br />– Evaluating models<br />– Exporting models for deployment <br />
Handling missing values in Rattle
Load Rattle weather dataset
- Transformtab-> Impute
- Several options:
- Zero/Missing
- The simplest imputation
- Replaces all missing values with a single value
- Numerical variable – 0
- Categorical variable – ‘Missing’
- Mean
- Use some ‘central’ value of the variable
- Numerical variable with normal distribution – Mean
- Numerical variable with skewed distribution – Median
- Categorical variable - Mode
- Median
- Mode
- Constant value
- Define own default value to be imputed
- Integer/real number for numerical variable
- Special marker for categorical variable
- Zero/Missing

Data transformation in Rattle
Transformtab->Rescale
- Recentering to be around 0
- Rescaling to be in [0-1]
- Robust rescaling around zero using the median
- Applying logarithm
- Multiple variables with one divisor (matrix)
- Ranking
- Rescaling by group (interval)
Recentering
- Common normalisation – recentres and rescales data
- Subtracts the mean value from each value of a variable (to recentre the variable)
- Divides by the standard deviation (to rescale)
Secaling[0-1]
- Rescaling to have a mean around zero (for non-negative variables)
- Subtracts the minimum value from each value of a variable
- Divides by the difference between maximum and minimum values
Robust rescaling
– Robust version of recentering option
– Subtracts the median value from each value of a variable (to recentre the variable)
– Divides by the median absolute deviation (MAD to rescale)
Logarithm transformation
– Variables with skewed distribution (such as income)
– Logarithm (as well as natural logarithm) effectively reduces the spread of values
– Base 10 logarithm: $10,000 -> 4, $100,000 -> 5, $1,000,000-> 6
Matirx
- Transforming data using multiple variables
- Calculates the sum of all values of multiple variables as matrix total
- Divides each value of a variable by the matrix total
Ranking
- Not the actual values, but the relative position within the distribution of values
- A list of integers (ranks)
E.g. [100,50,17,78,20,5,50,6] → [8, 5,3,7,4,1,5,2]
<br />
Data transformation using Python
Several Python packages available for data cleaning, profiling, and analysis
• Most important ones:
– Pandas: provides easy-to-use data structures and data analysis tools
– Numpy and Scipy: fundamental packages for scientific computing
– Sklearn: Library for machine learning in Python
– Matplotlib: For generating plots and visualisation
Loading data
Importing libraries
import pandas as pd
import numpy as np
import matplotlib.pyplot as plt
• Reading the dataset in a dataframe using Pandas
df = pd.read_csv(“weather.csv”)
Handling missing values in Python
- Checking the number of nulls/NaNs(not-a-number)in the data sets
df.apply(lambda x: sum(x.isnull()),axis=0)
• Prints number of null values in each variable
• Note: missing values may not always be NaNs.
– For example: Unknown, 0, -1
- Deletion
df.dropna(how=‘any’)
- Mean/median/modeimputation
df[‘MinTemp’].fillna(df[‘MinTemp’].mean(), inplace=True) df[‘MinTemp’].fillna(df[‘MinTemp’].median(), inplace=True) df[‘WindDir9am’].fillna(df[‘WindDir9am’].mode(), inplace=True)
- Recentering and rescaling
mean_val = df[‘WindGustSpeed’].mean()
std_val = df[‘WindGustSpeed’].std()
WindGustSpeedRct = []
for val in df[‘WindGustSpeed’]:
WindGustSpeedRct.append((val – mean_val) / std_val)
df[‘WindGustSpeedRct’] = WindGustSpeedRct
- Logarithm transformation
df[‘WindGustSpeed’].hist(bins=20)
df[‘WindGustSpeedLog’]=np.log(df[‘WindGustSpeed’])
df[‘WindGustSpeedLog’].hist(bins=20)
Lec 10
What is data integration?
In many organisations there is an increasing quest tointegrate data from different parts of the organisation, or to enrich data with external data
– Many applications require data from various sources
Data integration is the process of integrating data from multiple sources to obtain a single view over all sources
– To enable answering queries using the combined information
– Integration can be virtual (keep data at sources) or physical (copying the integrated data into a database or data warehouse)
Main reasons for data integration:
– Reuse data from various legacy databases and systems (often held as data silos)
– Reconcile the different points of views adopted by different systems in an organisation
– Integrate external data (such as social network data, information from statistical agencies, etc.)
A major challenge of data integration is heterogeneity 异构性
– At different levels: source type, schemas, data types, data values, semantics, etc.

Three main tasks of data integration
- Schema mapping and matching
- Identify which attributes or attribute sets across database tables contain the same type of information
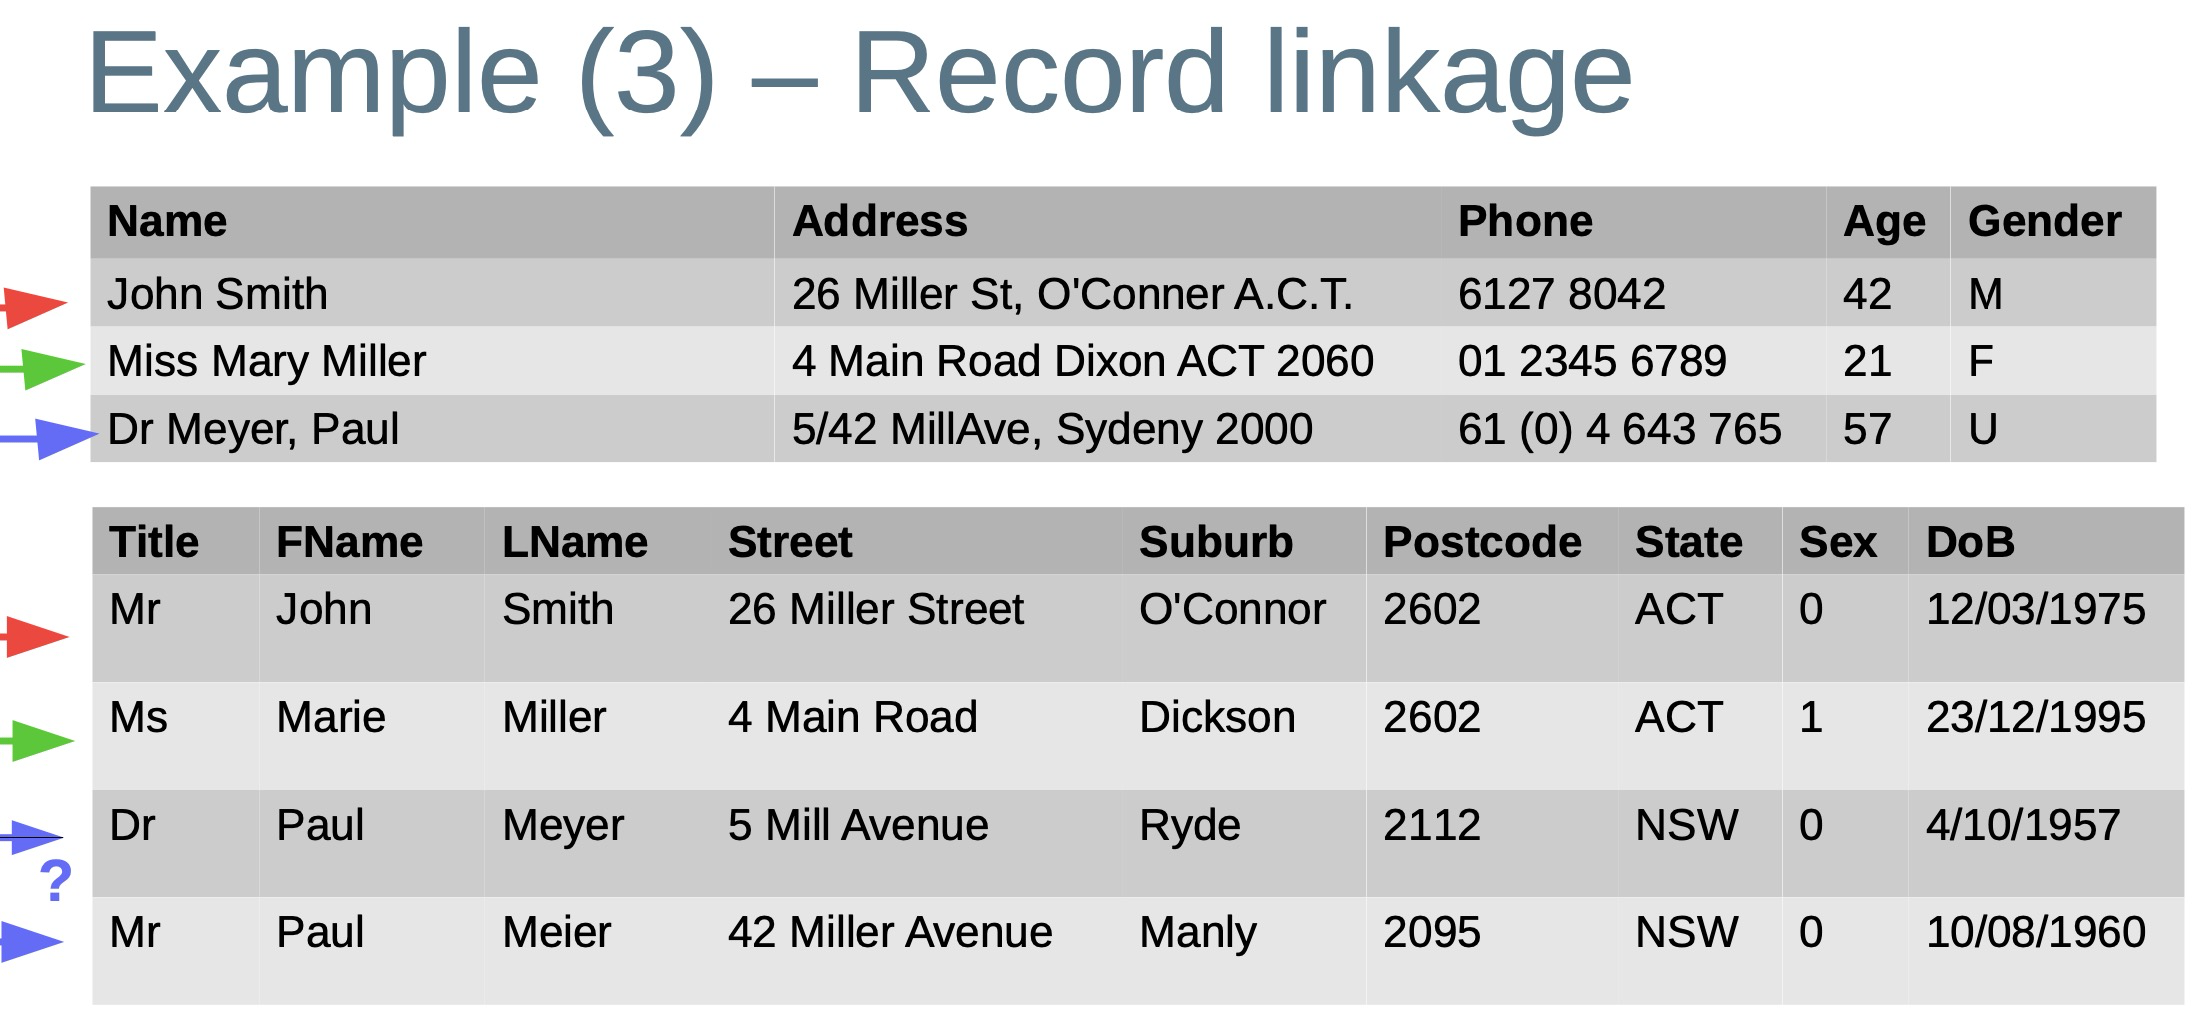
- Record linkage / data matching / entity resolution
- Identify which records in one or more databases correspond to the same real-world entity (person, business, product, etc.)
- A special case is deduplication (or duplicate detection) in a single database
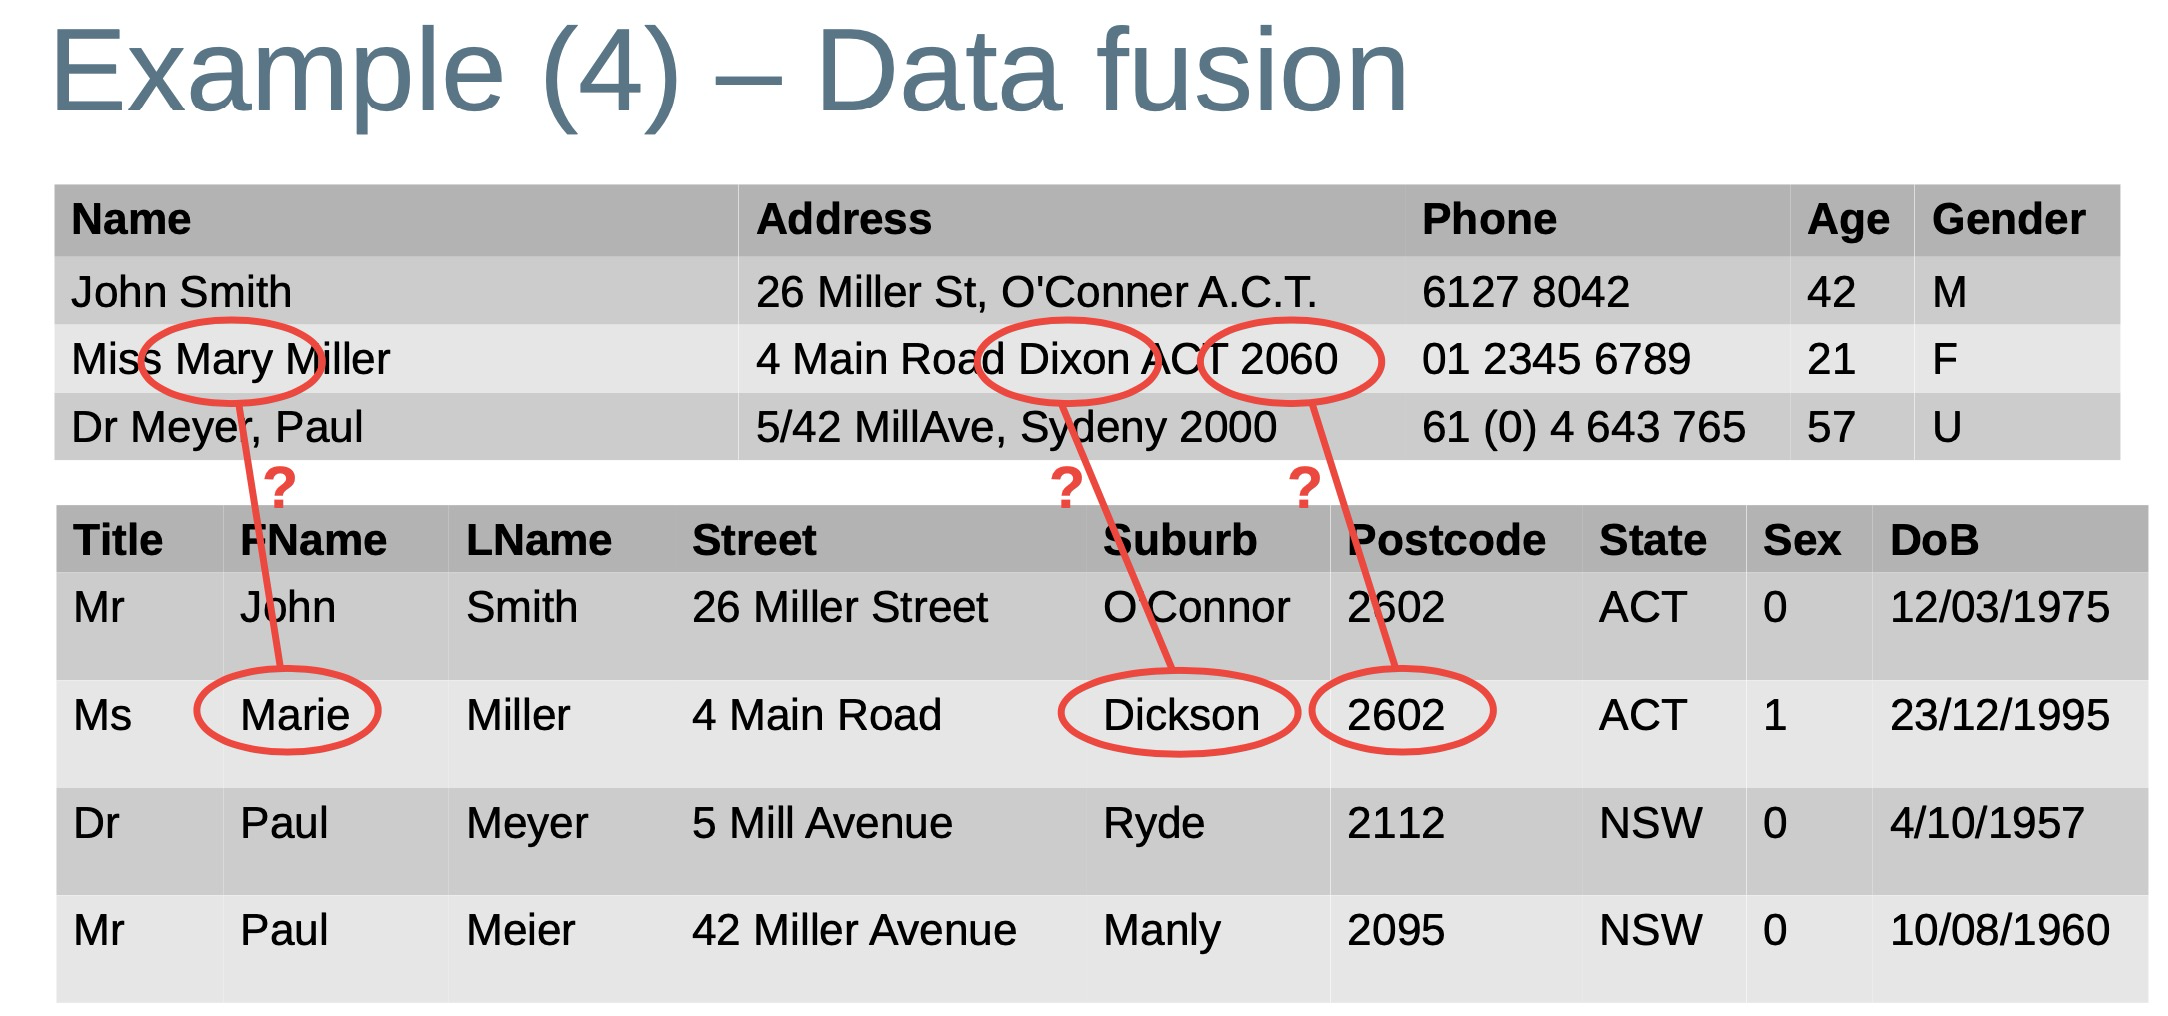
- Data fusion
- Merge pairs or groups of records that correspond to the same entity into one clean, up-to-date, and consistent record that represents the entity
Example application: World of Objects
Goal:
To enable various products in Yahoo! to synthesise knowledge-bases of entities relevant to their domains
(Bellare et al., VLDB, 2013)
Desiderata:
– Coverage: the fraction of real-world entities
– Accuracy: information must be accurate
– Linkage: the level of connectivity of entities
– Identifiability: one and only one identifier for a real-world entity
– Persistence/content continuity: variants of the same entity across time must be linked
– Multi-tenant: be useful to multiple portals
Woo: Knowledge-base synthesis
Knowledge-base synthesis is the process of ingestion,disambiguation, and enrichment of entities from a variety
of structured and unstructured data sources
– Sheer scale of the data ⇒ Hundreds of millions of entities daily
– Diverse domains ⇒ From hundreds of data sources
– Diverse requirements ⇒ Multiple tenants, such as Locals, Movies, Deals, and Events in (for example) the Yahoo! website

<br />Importer takes a collection of data sources as input (like XML feeds, RDF content, relational databases, or other custom formats)
Each data source is converted into a common format called WOO schema
The WOO Parcel, containing only the attributes needed for matching, is pushed to the Builder
Builder performs the entity deduplication and produces a clustering decision.
It includes: (1) Blocker, (2) Matcher, (3) Connected Component Generator, and (4) Group Refiner
Finalizer is responsible for handling the persistence of object identifiers and the blending (fusion) of the attributes of the (potentially many) entities that are being merged
Exporter generates a fully integrated and de-duplicated knowledge-base, either in a format consistent with the WOO schema or in any custom format
Curation enables domain experts to influence the system behaviour through a set of GUIs, such as forcing or disallowing certain matches between entities, or by editing attribute values
__
Lec 11
The schema matching problem 表单匹配问题
The problem of generating correspondences between elements of two database schemas 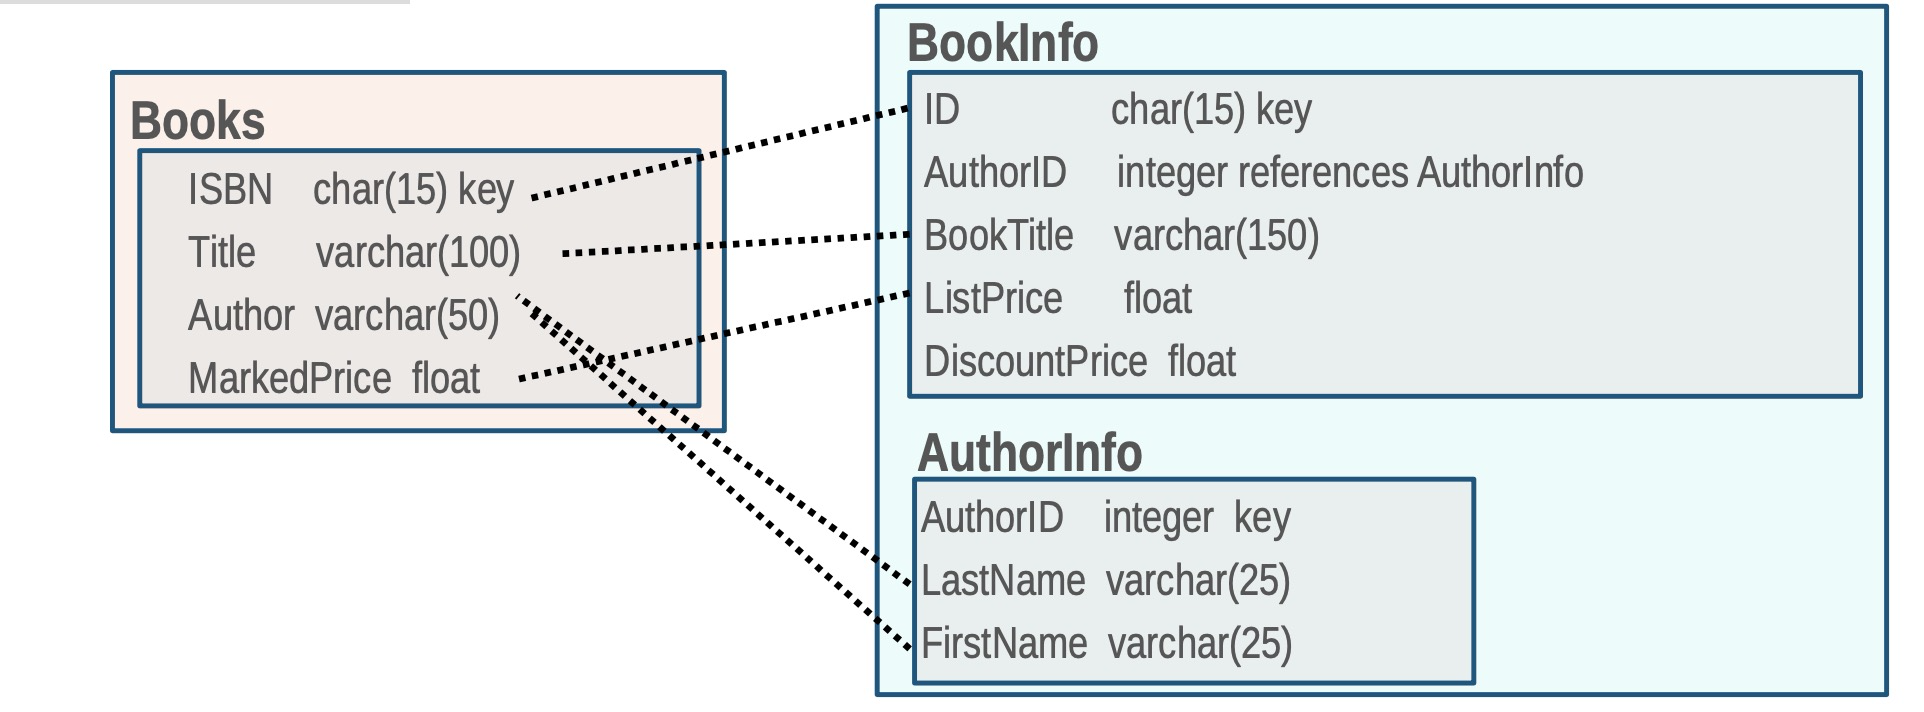
Basic input to matching techniques : Schema structures; element (attribute) names; and constraints such as data types and keys 匹配技术的基本输入:模式结构;元素(属性)名称;和约束,如数据类型和键
- Synonyms 同义词
- Code = Id = Num = No Zip = Postal [code]
- Acronyms 缩略词
PO = Purchase Order
UOM = Unit of Measure
SS# = Social Security Number
- Data instances (attribute values) 数据实例
Key insight: Elements match if they have similar instances or value distributions
Many applications need correspondences 很多的应用需要一致
- Data translation
– Object-to-relational mapping 对想到关系的映射
– XML message translation (for example between different applications) XML信息
– Data warehouse loading (ETL) 数据仓储的加载
- Data integration 数据聚合
– ER (entity relationship) design tools 实体关系设计工具
– Schema evolution (temporal changes) 表单演进
– Record linkage (next lecture) 链表记录
Match techniques
Linguistic matchers
– (String) similarity of concept/element names
– Based on dictionaries or thesauri, such as WordNet / UMLS
Structure-based matchers
– Consider similarity of ancestors/descendants
– Graph-based matching such as Similarity Flooding (Melnik et al., ICDE 2002)
Instance-based matchers
– Concepts with similar instances/annotated objects should match
– Consider all instances of a concept as a document and utilise document similarity (such as TF-IDF) to find matching concepts
Large-scale matching
- Very large ontologies / schemas (>10,000 elements)– Quadratic complexity of evaluating the Cartesian product
(match efficiency)
– Difficult to find all right correspondences (match quality)
– Support for user interaction
- Many (>>2) ontologies/schemas
– Holistic ontology/schema matching 整体本体/模式匹配
– Clustering of equivalent concepts/elements or linking to some hubs 同等概念/元素的群集或链接到一些中枢
Self-tuning match workflows
<br />Semi-automatic configuration<br />– Selection and ordering of matchers<br />– Combination of match results<br />– Selection of correspondences (top-k, threshold, ...) <br /> <br />Prototype tuning frameworks (Apfel, eTuner, YAM) – Use of supervised machine learning<br />– Need previously solved match problems for training – Difficult to support large schemas <br /> <br /> <br /> <br /> <br /> <br />

若有收获,就点个赞吧
0 人点赞
