General approach to determine outliers based on only one variable
For outliers based on only one numeric variable (attribute):
- Assume data is generated by an underlying Gaussian/normal distribution (or choose some other distribution).假设数据是由潜在的高斯/正态分布(或选择其他分布)生成的。
- Set parameters of the distribution from input data, using e.g. maximum likelihood 根据输入数据设置分布参数,例如使用最大似然
- Identify data points of low probability according to the fitted distribution as outliers 根据拟合分布将低概率数据点识别为异常值
1. Using IQR
Earlier we identified outliers for visual representation on boxplots, defined as values below Q1 − 1.5 IQR or above Q3 + 1.5 IQR. The same method for determination of outliers can be used more generally here.
2. Using maximum likelihood: Outliers are > 3 stddevs from the mean 使用最大似然:异常值是平均值的3倍以上
Example:
Consider the following data for temperature in Canberra at noon over 11 days:
{24.0, 28.9, 28.9, 28.9, 29.0, 29.1, 29.1, 29.2, 29.2, 29.3, 29.4}.
1. We will assume a normal distribution that is defined by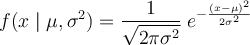
with parameters: mean  and variance
  .
.
- We will set these parameters to fit the distribution to our data by maximising likelihood.
Likelihood is defined as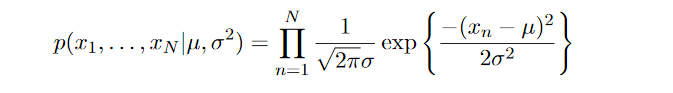
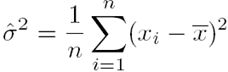
This can be maximised by taking derivatives of the log of the likelihood to get estimates for the maximum likelihood mean and maximum likelihood variance respectively:
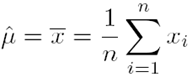
Using the temperatures in Canberra with  对象数量, we get
  平均值 and
 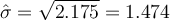 标准差
标准差
ACTION: Check this yourself
3. Now we can determine outliers as points of low probability by a heuristic such as:
An outlier is any value outside 3 estimated standard deviations from the estimated mean.
ACTION: Recall Chebyshev’s inequality. _It means that there can be _no values outside 3 standard deviations for a dataset of size n ≤ 9. So don’t try this method for such datasets!
So outliers fall outside平均值+- 3个标准差  .
.
In our temperature data, 24.0 is the only value that falls outside this range, and therefore 24.0 is an outlier.
**
3. Using Grubb’s test
Grubb’s test, also called the maximum normed residual test is an alternative heuristic to identify data points of low probability according to the fitted normal distribution as outliers. Strictly, the statistical assurance comes when both the data follows a normal distribution and at most one outlying value exists. In this formulation, we permit the outlying values to be at either the minimum or the maximum ends of the data, and so we use the two-sided t-test, and both the minimum and maximum should be tested. In practice, all values will be tested (or more efficiently, all values starting from each end until a non-outlier from each end is found).
Consider a dataset of  data points, with standard deviation
  .
.
You need to choose an  to apply this test, and by that determine the significance you want. This is not unlike having to choose the number of standard deviations in the maximising likelihood method above. A value of
  = 0.05 is typical.
Define the z-score for a data point  as
as  , that is, the point’s distance from the sample mean as a proportion of the standard deviation.
Then, according to Grubb’s test  is an outlier if
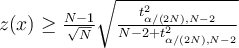
where  is the critical value taken by a t-distribution with degrees of freedom
  at a significance level of
  .
.
You can look up this critical value in a table such as http://www.itl.nist.gov/div898/handbook/eda/section3/eda3672.htm or T-distribution table or you can use the Excel T.INV function. Use the one-sided formulation of the tables because the two-sidedness is already taken in to account by the significance level indicated here.
N.B The text has an error that is corrected here; the text has the critical value taken by the t-distribution to be the square of the  value given here.
Example
Using the Canberra temperature data above, we will test if the minimum value, 24.0, is an outlier by Grubb’s test.
Choose  . From above, we have that
  . Then
 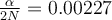 and
and  . Then lookup
  using co-ords (0.99773, 9) to get 3.250. Here, we approximate by taking the lower value of the nearby columns in the table to be slightly more permissive in assigning data values to be outliers. Now we have that 24.0 is an outlier if
  . So 24.0 is an outlier.
You should also check for the other extreme value, the maximum 29.4, in the same way. Let us assume you find that 29.4 is not an outlier.
When you find that either (or both) extreme value is an outlier, in this case only 24.0, you need to remove the outlier(s) from the dataset and iterate to look for any more outliers. 当您发现其中一个(或两个)极值是异常值时,在这种情况下只有24.0,您需要从数据集中移除异常值并迭代以寻找更多异常值。To do this you will apply Grubb’s test to 28.9 and 29.4 in {28.9, 28.9, 28.9, 29.0, 29.1, 29.1, 29.2, 29.2, 29.3, 29.4}, noting that  ,
,  , and
, and  will need to be recomputed on the smaller dataset. If you find that one or both of those is an outlier too, then remove it/them from the data and repeat. Stop whenever you have removed “enough” (whatever “enough” means to your problem), or when Grubbs’ test fails to find an outlier, or when your dataset gets small enough for you to determine an outlier by your own domain-dependent judgement (which is likely to be size much bigger than 11!).

若有收获,就点个赞吧
0 人点赞
