引入geo数据
地图JSON数据来源:
在tsconfig.json中添加配置,允许TS中导入json文件
"resolveJsonModule": true,
显示地图及Tooltip轮播
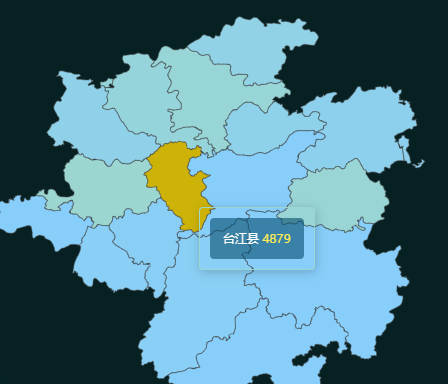
import React, { useRef, useEffect, useState } from 'react'import XHData from '../geo/geoData.json'import * as echarts from 'echarts'import { createEchartsOptions } from '../shared/create-echart-options'export const Chart6 = () => {const divRef = useRef(null)useEffect(() => {let index = -1const myChart = echarts.init(divRef.current)// myChart.hideLoading()// @ts-ignoreecharts.registerMap('XH', XHData)let mTime = null// 实现ToolTip高亮轮播function mapActive() {const dataLength = XHData.features.length// 用定时器控制高亮mTime = setInterval(() => {// 清除之前的高亮myChart.dispatchAction({type: 'downplay',seriesIndex: 0,dataIndex: index,})index++// 当前下标高亮myChart.dispatchAction({type: 'highlight',seriesIndex: 0,dataIndex: index,})myChart.dispatchAction({type: 'showTip',seriesIndex: 0,dataIndex: index,})if (index > dataLength) {index = 0}}, 2000)}mapActive()myChart.on('mouseover', () => {// 停止定时器,清除之前的高亮console.log('mouseover')clearInterval(mTime)mTime = nullmyChart.dispatchAction({type: 'downplay',seriesIndex: 0,dataIndex: index,})})// 鼠标划出重新定时器开始myChart.on('mouseout', () => {mapActive()})const option = {xAxis: { show: false },yAxis: { show: false },tooltip: {trigger: 'item',backgroundColor: 'rgba(0,0,0,0)',},visualMap: {show: false,min: 800,max: 50000,text: ['High', 'Low'],realtime: false,calculable: true,inRange: {color: ['lightskyblue', 'yellow', 'orangered'],},},series: [{tooltip: {trigger: 'item',// 自定义tooltip样式formatter: function (item) {var tipHtml = ''tipHtml = `<div style="padding: .6rem .8rem;font-size: .325rem;color:#fff;border-radius:4px;background-size: .08rem .3rem, .3rem .08rem;background-color:rgba(6, 79, 111,.6);">${item.data.name} <span style="color:#f9eb59;font-size:.4rem">${item.data.value}</span> </div>`return tipHtml},// borderWidth: 0,},label: { show: false },data: [],name: '西虹市地图',type: 'map',mapType: 'XH', // 自定义扩展图表类型aspectScale: 1,layoutCenter: ['49%', '47%'], //地图位置layoutSize: '90%', // 缩放比例itemStyle: {color: 'transparent', // 去除坐标小圆点emphasis: {label: {show: true,},},},},],}option.series[0].data = XHData.features.map((item) => {// 显示窗口的数据转换return {value: (Math.random() * 5000).toFixed(0),name: item.properties.name,}})myChart.setOption(createEchartsOptions(option))return () => clearInterval(mTime)}, [])return (<div className="bordered 籍贯"><h2>全市案件侦破实时记录</h2><div ref={divRef} className="chart" /></div>)}
监控扫描动画

<div className="scan-animation"><div className="ring"><div className="radar" /></div><span>数据实时监控中</span></div>
> .scan-animation {position: absolute;bottom: px(20);left: px(24);display: flex;align-items: center;flex-direction: column;gap: px(10);> span {font-size: px(4);color: #a1d1f1;}> .ring {border: 1px solid #0c2939;width: px(96);height: px(96);border-bottom: none;border-radius: 50%;overflow: hidden;animation: spin infinite 5s linear;> .radar {border: 2px solid #103142;position: absolute;width: px(81);height: px(81);top: 50%;left: 50%;transform: translate(-50%, -50%);border-radius: 50%;&::before {content: '';position: absolute;top: 50%;left: 50%;transform: translate(-50%, -50%);width: px(42);height: px(42);border: 2px solid #082132;border-radius: 50%;}&::after {content: '';position: absolute;top: 0;left: 50%;transform: translateX(-50%);width: px(3);height: px(36);z-index: 1;background: #007cc0;border-radius: 50%;box-shadow: 0 0 5px 1px #0094e4, -3px -10px 5px 1px #0094e4,-7px -15px 10px 1px #0094e4, -3px -3px 10px 1px #0094e4,-7px -7px 20px 1px #0094e4, -11px -11px 30px 1px #0094e4,-11px -11px 40px 1px #0094e4, -11px -11px 30px 1px #0094e4,-11px -11px 30px 1px #0094e4;}}}@keyframes spin {from {transform: rotate(0);}to {transform: rotate(360deg);}}}}
显示访问数量
- 重点是要在 useEffect 中返回清除函数,清除掉上一个 setInterval, 否则每次重新渲染都会新增一个 setInterval
- 使用
number.toLocaleString()将数字格式化,每三位显示一个逗号,也可以使用toLocaleString('en-US')

import React, { useRef, useEffect, useState } from 'react'export const Chart6 = () => {const [count, setCount] = useState(325920)useEffect(() => {const timer = setInterval(() => {setCount(count + 1)}, 500)return () => {clearInterval(timer)}}, [count])return (<div className="bordered note"><span>{count.toLocaleString()}</span><span>接待访客</span></div>)}
[

若有收获,就点个赞吧
0 人点赞
