基础折线图
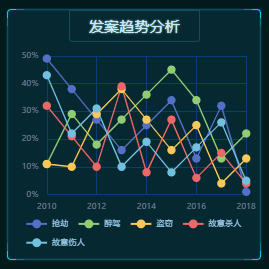
import React, { useEffect, useRef } from 'react'import * as echarts from 'echarts'import { createEchartsOptions } from '../shared/create-echart-options'import { px } from '../shared/px'export const Chart3 = () => {const divRef = useRef(null)useEffect(() => {var myChart = echarts.init(divRef.current)myChart.setOption(createEchartsOptions({legend: {bottom: px(10),textStyle: { color: 'white' },itemWidth: px(30),itemHeight: px(16),},grid: {x: px(20),x2: px(20),y: px(20),y2: px(70),containLabel: true,},xAxis: {type: 'category',boundaryGap: false,data: [2010, 2011, 2012, 2013, 2014, 2015, 2016, 2017, 2018],splitLine: { show: true, lineStyle: { color: '#073E78' } },axisTick: { show: false },axisLine: { show: false },},yAxis: {type: 'value',splitLine: { lineStyle: { color: '#073E78' } },axisLabel: {formatter(val) {return val * 100 + '%'},},},series: [{name: '抢劫',type: 'line',data: [0.01, 0.32, 0.13, 0.34, 0.25, 0.16, 0.27, 0.38, 0.49,].reverse(),},{name: '醉驾',type: 'line',data: [0.22, 0.13, 0.34, 0.45, 0.36, 0.27, 0.18, 0.29, 0.11,].reverse(),},{name: '盗窃',type: 'line',data: [0.13, 0.04, 0.25, 0.16, 0.27, 0.38, 0.29, 0.1, 0.11,].reverse(),},{name: '故意杀人',type: 'line',data: [0.04, 0.15, 0.06, 0.27, 0.08, 0.39, 0.1, 0.21, 0.32,].reverse(),},{name: '故意伤人',type: 'line',data: [0.05, 0.26, 0.17, 0.08, 0.19, 0.1, 0.31, 0.22, 0.43,].reverse(),},].map((obj) => ({ // 设置转折点为圆点...obj,symbol: 'circle',symbolSize: px(12),lineStyle: { width: px(2) },})),}))}, [])return (<div className="bordered 发案趋势"><h2>发案趋势分析</h2><div ref={divRef} className="chart" /></div>)}
基础面积图
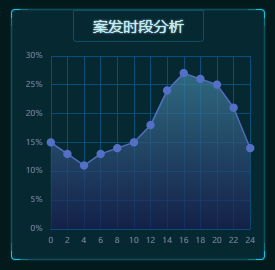
import React, { useEffect, useRef } from 'react'import * as echarts from 'echarts'import { createEchartsOptions } from '../shared/create-echart-options'import { px } from '../shared/px'export const Chart4 = () => {const divRef = useRef(null)useEffect(() => {var myChart = echarts.init(divRef.current)myChart.setOption(createEchartsOptions({xAxis: {type: 'category',boundaryGap: false,data: [0, 2, 4, 6, 8, 10, 12, 14, 16, 18, 20, 22, 24],splitLine: { show: true, lineStyle: { color: '#073E78' } },axisTick: { show: false },axisLine: { show: false },},yAxis: {type: 'value',splitLine: { lineStyle: { color: '#073E78' } },axisLabel: {formatter(val) {return val * 100 + '%'},},},series: [{name: '故意伤人',type: 'line',data: [0.15, 0.13, 0.11, 0.13, 0.14, 0.15, 0.18, 0.24, 0.27, 0.26, 0.25,0.21, 0.14,],symbol: 'circle',symbolSize: px(12),lineStyle: { width: px(2) },// 面积颜色渐变areaStyle: {color: new echarts.graphic.LinearGradient(0, 0, 0, 1, [{offset: 0,color: '#414a9f',},{offset: 1,color: '#1b1d52',},]),},},],}))}, [])return (<div className="bordered 案发时段"><h2>案发时段分析</h2><div ref={divRef} className="chart" /></div>)}

若有收获,就点个赞吧
0 人点赞
