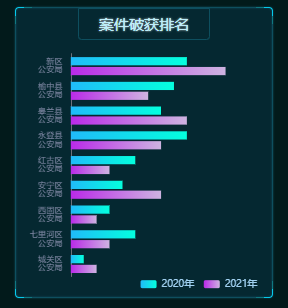
在 series 中添加 itemStyle 可实现渐变
const option = createEchartsOptions({xAxis: {type: 'value',boundaryGap: [0, 0.01],splitLine: { show: false },axisLabel: { show: false },},yAxis: {type: 'category',axisTick: { show: false },data: ['城关区公安局','七里河区公安局','西固区公安局','安宁区公安局','红古区公安局','永登县公安局','皋兰县公安局','榆中县公安局','新区公安局',],axisLabel: {formatter(val) {return val.replace('公安局', '\n公安局')},},},legend:{bottom: 0,right: 0,itemHeight: 8,itemWidth: 16,textStyle: {color: '#79839E'}},series: [{name: '2020年',type: 'bar',data: [1, 5, 3, 4, 5, 9, 7, 8, 9],itemStyle: {normal: {color: new echarts.graphic.LinearGradient(0, 0, 1, 0, [{offset: 0,color: '#2034f9'}, {offset: 1,color: '#04a1ff'}]),}}},{name: '2021年',type: 'bar',data: [2, 3, 2, 7, 3, 7, 9, 6, 12],itemStyle: {normal: {color: new echarts.graphic.LinearGradient(0, 0, 1, 0, [{offset: 0,color: '#b92ae8'}, {offset: 1,color: '#6773e7'}]),}}},],})

若有收获,就点个赞吧
0 人点赞
