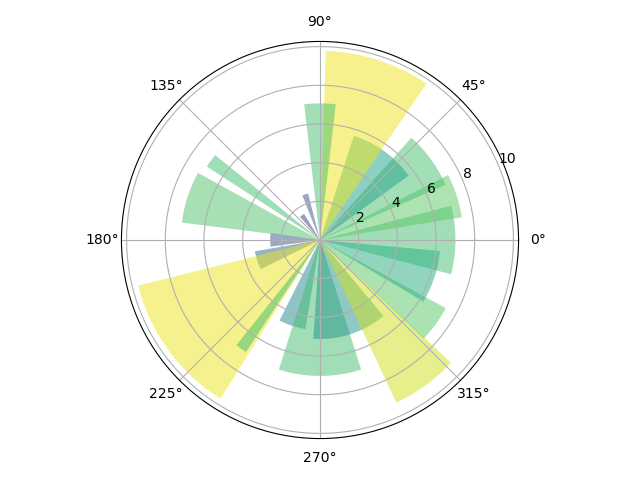
import matplotlib.pyplot as plt# Fixing random state for reproducibilitynp.random.seed(19680801)# Compute pie slicesN = 20theta = np.linspace(0.0, 2 * np.pi, N, endpoint=False)radii = 10 * np.random.rand(N)width = np.pi / 4 * np.random.rand(N)colors = plt.cm.viridis(radii / 10.)ax = plt.subplot(111, projection='polar')ax.bar(theta, radii, width=width, bottom=0.0, color=colors, alpha=0.5)plt.show()

若有收获,就点个赞吧
0 人点赞
