箱线图(Box-plot)又称为盒式图或箱形图,是一种用作显示一组数据分散情况的统计图。它能显示出一组数据的最大值、最小值、中位数及上下四分位数。因形状如箱子而得名。在各种领域经常被使用,常见于品质管理。
Seaborn中的箱型图的由boxplot()方法实现,boxplot()的参数及其意义如下:
seaborn.boxplot(x=None, y=None, hue=None, data=None,order=None, hue_order=None, orient=None,color=None, palette=None, saturation=0.75,width=0.8, dodge=True, fliersize=5, linewidth=None,whis=1.5, notch=False, ax=None, **kwargs)
(1) x,y:dataframe中的列名(str)或者矢量数据
(2)
data:dataframe或者数组
(3)
palette:调色板,控制图像的色调
(4)
hue:dataframe的列名,按照列名中的值分类形成分类的条形图
(5) order, hue_order (lists of strings):用于控制条形图的顺序
(6)
orient:”v”|”h” 用于控制图像使水平还是竖直显示,通常是从输入变量的dtype推断出来的,此参数一般当不传入x、y,只传入data的时候使用。
(7) fliersize:float,用于指示离群值观察的标记大小
(8)
whis:确定离群值的上下界(IQR超过低和高四分位数的比例),此范围之外的点将被识别为异常值。IQR指的是上下四分位的差值。
(9)
width:float,控制箱型图的宽度
根据Species和PetalLengthCm这两列数据绘制箱线图(如图10.42所示)可以直观地查看不同花类型的分布。
import pandas as pd # 导入pandas库import warnings # 载入当前版本seaborn库时会有警告出现,先载入warnings,忽略警告import seaborn as sns # 导入seaborn库import matplotlib.pyplot as plt # 导入matplotlib库warnings.filterwarnings("ignore") # 忽略警告sns.set(style="white", color_codes=True) # 确定主题为whiteiris = pd.read_csv("iris.csv") # 读取csv数据并转为Pandas的 DataFrame格式# Seaborn中的boxplot,可以画箱线图,通过箱线图来查看单个特征的分布# 对 Numerical Variable,可以用 Box Plot 来直观地查看不同花类型的分布。sns.boxplot(x="Species", y="PetalLengthCm", data=iris)plt.show()
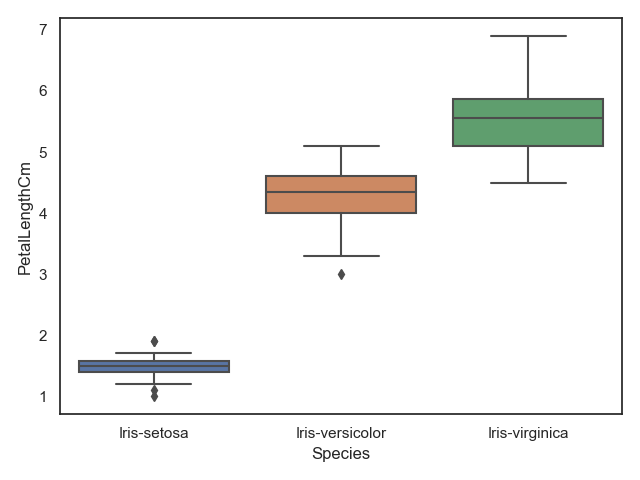
箱线图
利用striplot()可以将每一个Species所属的点加到对应的位置,加上散点图,此时应该设振动值jitter=True
使各个散点分开,不然会是一条直线。
import pandas as pd # 导入pandas库import warnings # 载入当前版本seaborn库时会有警告出现,先载入warnings,忽略警告import seaborn as sns # 导入seaborn库import matplotlib.pyplot as plt # 导入matplotlib库warnings.filterwarnings("ignore") # 忽略警告sns.set(style="white", color_codes=True) # 确定主题为whiteiris = pd.read_csv("iris.csv") # 读取csv数据并转为Pandas的 DataFrame格式# 注意此处要将坐标图用ax先保存起来,这样第二次才会在原来的基础上加上散点图sns.boxplot(x="Species", y="PetalLengthCm", data=iris)sns.stripplot(x="Species", y="PetalLengthCm", data=iris, jitter=True, edgecolor="gray")plt.show()
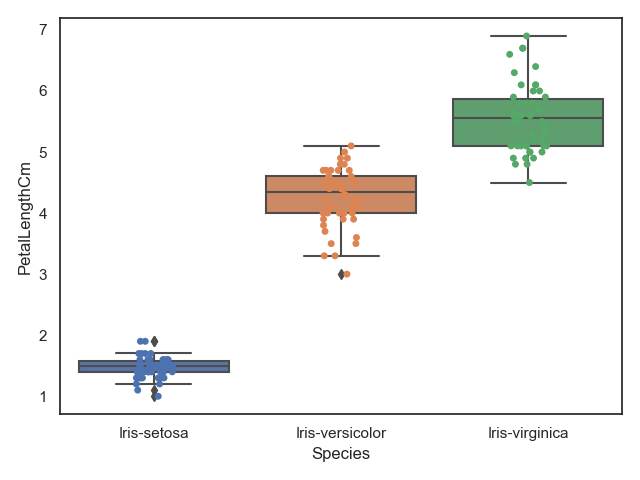
箱线图+散点图

若有收获,就点个赞吧
0 人点赞
