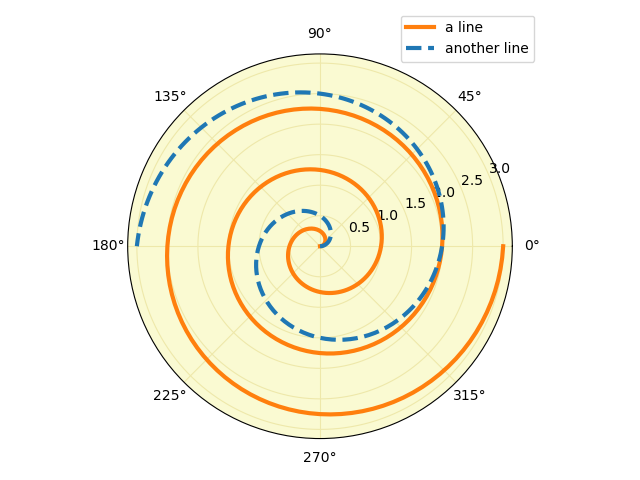
import matplotlib.pyplot as pltimport numpy as npfig = plt.figure()ax = fig.add_subplot(projection="polar", facecolor="lightgoldenrodyellow")r = np.linspace(0, 3, 301)theta = 2 * np.pi * rax.plot(theta, r, color="tab:orange", lw=3, label="a line")ax.plot(0.5 * theta, r, color="tab:blue", ls="--", lw=3, label="another line")ax.tick_params(grid_color="palegoldenrod")# For polar axes, it may be useful to move the legend slightly away from the# axes center, to avoid overlap between the legend and the axes. The following# snippet places the legend's lower left corner just outside of the polar axes# at an angle of 67.5 degrees in polar coordinates.angle = np.deg2rad(67.5)ax.legend(loc="lower left", bbox_to_anchor=(.5 + np.cos(angle)/2, .5 + np.sin(angle)/2))plt.show()


