from pyecharts import options as optsfrom pyecharts.charts import Bar, Grid, Line, Liquid, Page, Piefrom pyecharts.commons.utils import JsCodefrom pyecharts.components import Tablefrom pyecharts.faker import Fakerdef bar_datazoom_slider() -> Bar:c = (Bar().add_xaxis(Faker.days_attrs).add_yaxis("商家A", Faker.days_values).set_global_opts(title_opts=opts.TitleOpts(title="Bar-DataZoom(slider-水平)"),datazoom_opts=[opts.DataZoomOpts()],))return cdef line_markpoint() -> Line:c = (Line().add_xaxis(Faker.choose()).add_yaxis("商家A",Faker.values(),markpoint_opts=opts.MarkPointOpts(data=[opts.MarkPointItem(type_="min")]),).add_yaxis("商家B",Faker.values(),markpoint_opts=opts.MarkPointOpts(data=[opts.MarkPointItem(type_="max")]),).set_global_opts(title_opts=opts.TitleOpts(title="Line-MarkPoint")))return cdef pie_rosetype() -> Pie:v = Faker.choose()c = (Pie().add("",[list(z) for z in zip(v, Faker.values())],radius=["30%", "75%"],center=["25%", "50%"],rosetype="radius",label_opts=opts.LabelOpts(is_show=False),).add("",[list(z) for z in zip(v, Faker.values())],radius=["30%", "75%"],center=["75%", "50%"],rosetype="area",).set_global_opts(title_opts=opts.TitleOpts(title="Pie-玫瑰图示例")))return cdef grid_mutil_yaxis() -> Grid:x_data = ["{}月".format(i) for i in range(1, 13)]bar = (Bar().add_xaxis(x_data).add_yaxis("蒸发量",[2.0, 4.9, 7.0, 23.2, 25.6, 76.7, 135.6, 162.2, 32.6, 20.0, 6.4, 3.3],yaxis_index=0,color="#d14a61",).add_yaxis("降水量",[2.6, 5.9, 9.0, 26.4, 28.7, 70.7, 175.6, 182.2, 48.7, 18.8, 6.0, 2.3],yaxis_index=1,color="#5793f3",).extend_axis(yaxis=opts.AxisOpts(name="蒸发量",type_="value",min_=0,max_=250,position="right",axisline_opts=opts.AxisLineOpts(linestyle_opts=opts.LineStyleOpts(color="#d14a61")),axislabel_opts=opts.LabelOpts(formatter="{value} ml"),)).extend_axis(yaxis=opts.AxisOpts(type_="value",name="温度",min_=0,max_=25,position="left",axisline_opts=opts.AxisLineOpts(linestyle_opts=opts.LineStyleOpts(color="#675bba")),axislabel_opts=opts.LabelOpts(formatter="{value} °C"),splitline_opts=opts.SplitLineOpts(is_show=True, linestyle_opts=opts.LineStyleOpts(opacity=1)),)).set_global_opts(yaxis_opts=opts.AxisOpts(name="降水量",min_=0,max_=250,position="right",offset=80,axisline_opts=opts.AxisLineOpts(linestyle_opts=opts.LineStyleOpts(color="#5793f3")),axislabel_opts=opts.LabelOpts(formatter="{value} ml"),),title_opts=opts.TitleOpts(title="Grid-多 Y 轴示例"),tooltip_opts=opts.TooltipOpts(trigger="axis", axis_pointer_type="cross"),))line = (Line().add_xaxis(x_data).add_yaxis("平均温度",[2.0, 2.2, 3.3, 4.5, 6.3, 10.2, 20.3, 23.4, 23.0, 16.5, 12.0, 6.2],yaxis_index=2,color="#675bba",label_opts=opts.LabelOpts(is_show=False),))bar.overlap(line)return Grid().add(bar, opts.GridOpts(pos_left="5%", pos_right="20%"), is_control_axis_index=True)def liquid_data_precision() -> Liquid:c = (Liquid().add("lq",[0.3254],label_opts=opts.LabelOpts(font_size=50,formatter=JsCode("""function (param) {return (Math.floor(param.value * 10000) / 100) + '%';}"""),position="inside",),).set_global_opts(title_opts=opts.TitleOpts(title="Liquid-数据精度")))return cdef table_base() -> Table:table = Table()headers = ["City name", "Area", "Population", "Annual Rainfall"]rows = [["Brisbane", 5905, 1857594, 1146.4],["Adelaide", 1295, 1158259, 600.5],["Darwin", 112, 120900, 1714.7],["Hobart", 1357, 205556, 619.5],["Sydney", 2058, 4336374, 1214.8],["Melbourne", 1566, 3806092, 646.9],["Perth", 5386, 1554769, 869.4],]table.add(headers, rows).set_global_opts(title_opts=opts.ComponentTitleOpts(title="Table"))return tabledef page_draggable_layout():page = Page(layout=Page.DraggablePageLayout)page.add(bar_datazoom_slider(),line_markpoint(),pie_rosetype(),grid_mutil_yaxis(),liquid_data_precision(),table_base(),)page.render("page_draggable_layout.html")if __name__ == "__main__":page_draggable_layout()
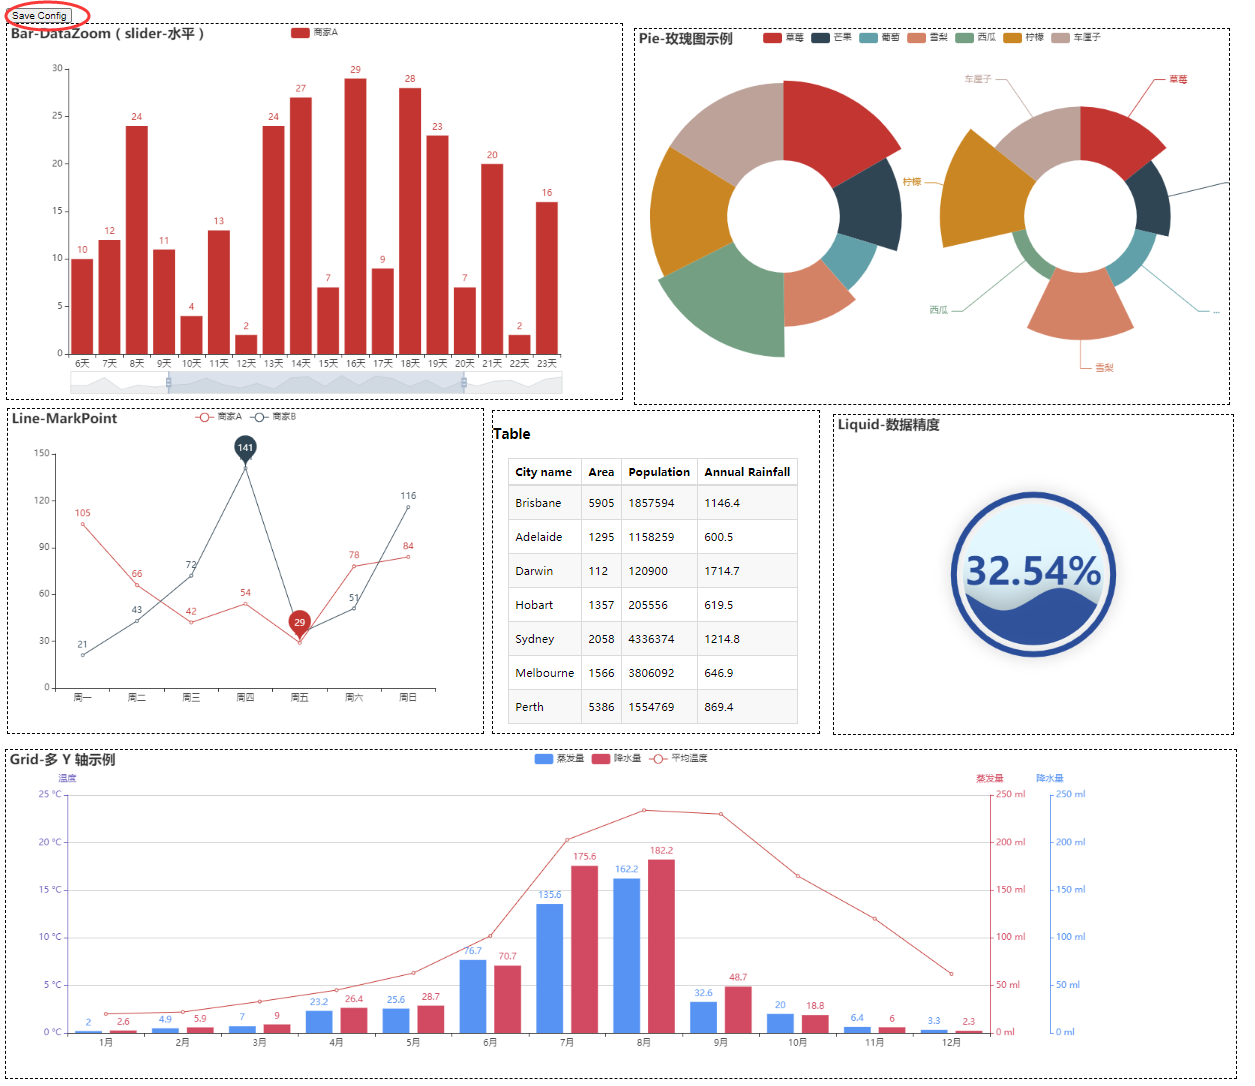
生成的page_draggable_layout.html页面上各图是自上而下排列,可用鼠标拖动重置位置和大小。然后点第一幅图左上角的”Save Config”将配置文件保存为chart_config.json 文件,默认保存在当前用户的下载文件夹中。将其复制到page_draggable_layout.html文件相同文件夹下,然后注释掉渲染函数的调用(网页已经生成,不需要重新渲染,只需要改变位置及大小即可),加上以下语句:
if __name__ == "__main__":
    # page_draggable_layout()
    Page.save_resize_html("page_draggable_layout.html", cfg_file="./chart_config.json", dest="my_new_charts.html")

若有收获,就点个赞吧
0 人点赞
