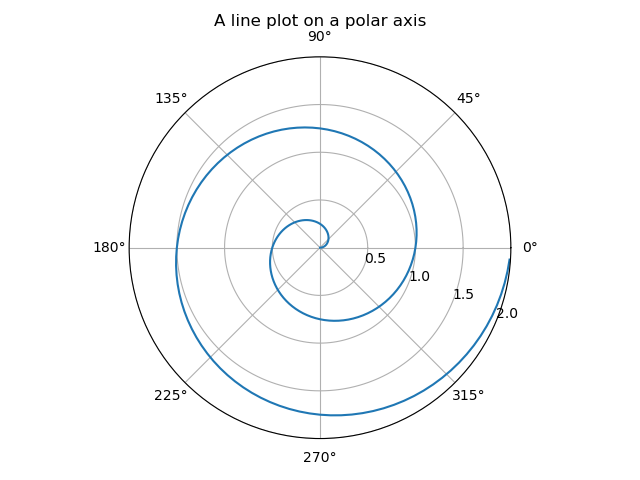
import numpy as npimport matplotlib.pyplot as pltr = np.arange(0, 2, 0.01)theta = 2 * np.pi * rax = plt.subplot(111, projection='polar')ax.plot(theta, r)ax.set_rmax(2)ax.set_rticks([0.5, 1, 1.5, 2]) # Less radial ticksax.set_rlabel_position(-22.5) # Move radial labels away from plotted lineax.grid(True)ax.set_title("A line plot on a polar axis", va='bottom')plt.show()

若有收获,就点个赞吧
0 人点赞
