用matplotlib实现
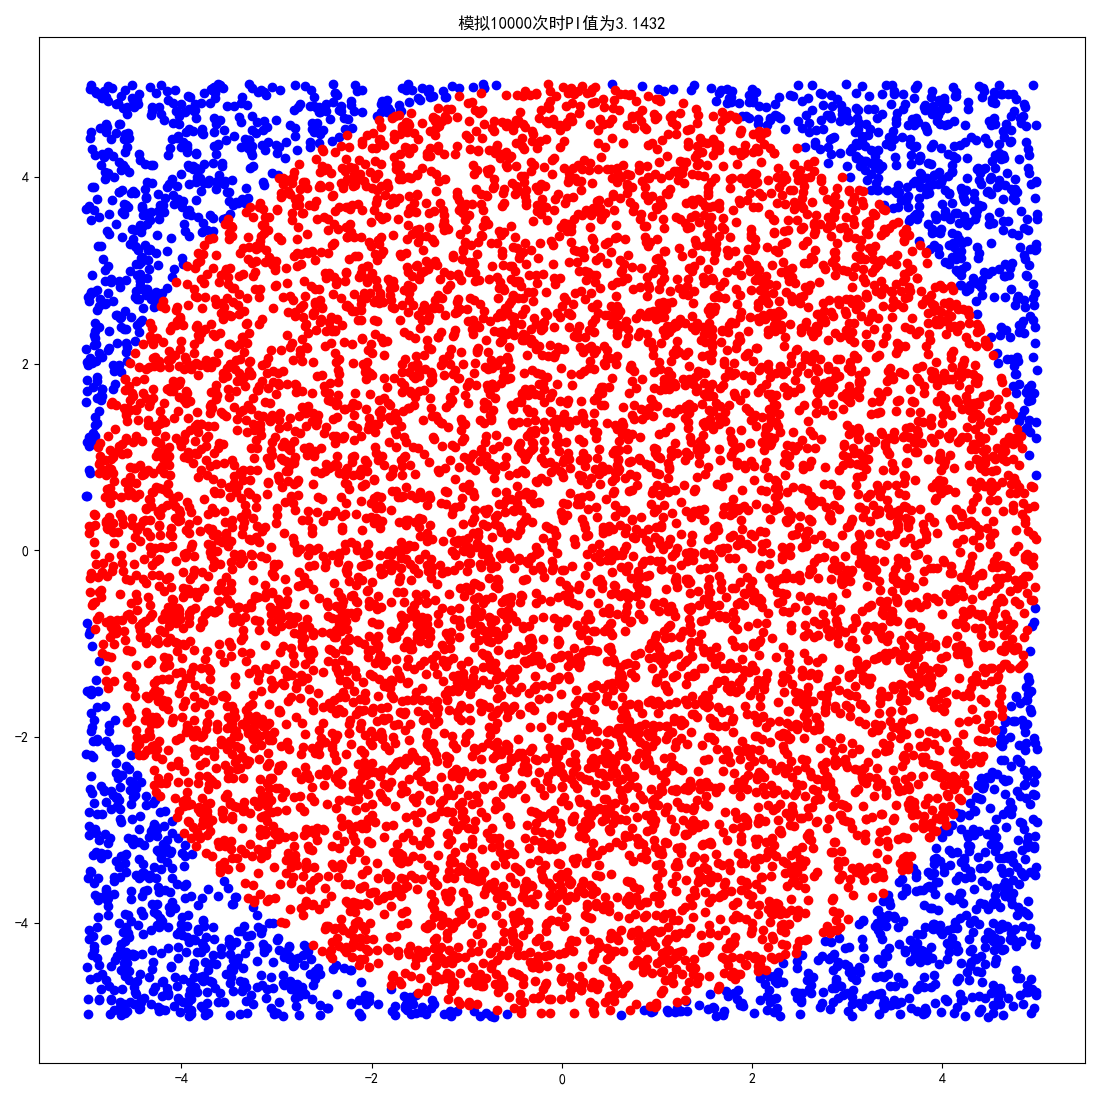
import matplotlib.pyplot as pltimport numpy as np# 支持中文plt.rcParams['font.sans-serif'] = ['SimHei'] # 用来正常显示中文标签plt.rcParams['axes.unicode_minus'] = False # 用来正常显示负号count = 10000plt.figure(figsize=(11,11)) # 设置画布长宽a,hits = 5,0 # 设置随机数范围lsx = [] # 落在圆外的点的列表xlsy = [] # 落在圆外的点的列表ylsPx = [] # 落在圆内的点的列表xlsPy = [] # 落在圆内的点的列表yfor i in range(count):x,y = np.random.uniform(-a,a),np.random.uniform(-a,a)pos = (x ** 2 + y ** 2) ** 0.5 # 计算坐标(x,y)到原点的距离if pos <= 5.0: # 如果距离小于等于5,点在圆内lsPx.append(x)lsPy.append(y)cl = 'red'else: # 如果距离大于5.0,点在圆外lsx.append(x)lsy.append(y)cl = 'blue'plt.scatter(lsx,lsy,facecolors='blue') # 绘制散点,落在圆外在点颜色用蓝色plt.scatter(lsPx,lsPy,facecolors='red') # 绘制散点,落在圆内在点颜色用红色PI = 4 * len(lsPx) / count # 落在圆内的点数与总数的比值为面积比值,可计算PI值plt.title('模拟{}次时PI值为{}'.format(count,PI)) # 用算得的PI值做图的标题plt.show() # 显示绘制结果
turtle实现
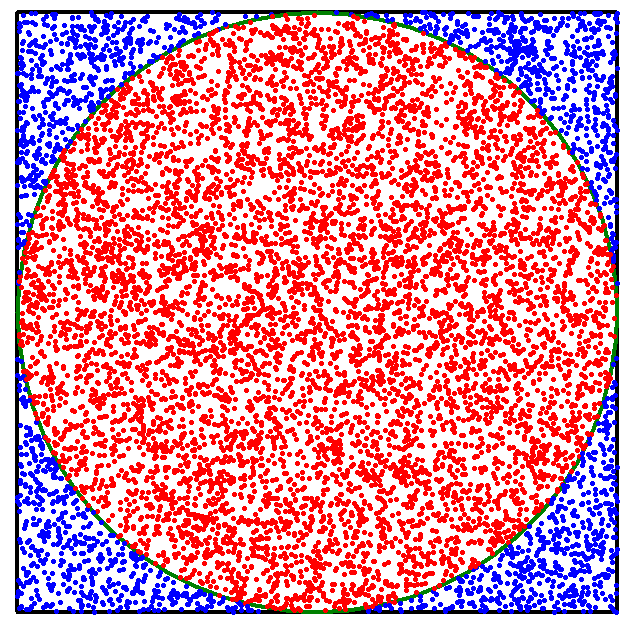
import random # 导入随机数库import turtle # 导入turtle库n = int(input())# random.seed(10)# turtle.tracer(10) 刷新间隔,提高绘制速度turtle.pensize(4)turtle.penup()turtle.goto(-300, -300)turtle.pendown()for i in range(4):turtle.forward(600)turtle.left(90)turtle.forward(300)turtle.pencolor('green')turtle.circle(300)hits = 0 # 落在圆内的计数器初值设为 0for i in range(1, n+1):x, y = random.random(), random.random() # 生成两个随机数模拟一个点的坐标signx,signy = random.choice('+-'),random.choice('+-')# 随机生成x和y的符号“+”或“-”pos = (x ** 2 + y ** 2)**0.5 # 计算坐标(x,y)到原点的距离if pos <= 1.0: # 如果距离小于等于1,点在圆内hits = hits + 1turtle.pencolor('red') # 落在圆内在点颜色用红色else: # 如果距离大于1,点在圆外turtle.pencolor('blue') # 落在圆内在点颜色用蓝色x = float(signx+str(x)) # 将 x 值与符号拼接并转为浮点数y = float(signy+str(y)) # 将 y 值与符号拼接并转为浮点数turtle.penup()turtle.goto(x * 300, y * 300) # 画笔抬起并移动到数值放大400倍的x,y处turtle.pendown()turtle.dot(5) # 画一个半径为 3 的圆点if i % 10000 == 0: # 实验为10000的倍数次时turtle.pencolor('black')pi = 4 * (hits / i) # 根据落在圆内外的点数量估算PI值turtle.penup() # 画笔抬起turtle.goto(320, 150- i // 1000 * 30) # 移动到区域外记录当前PI值turtle.pendown() # 画笔抬起turtle.write("{}次时PI的值是{:.4f}".format(i,pi),font=("宋体", 18, "normal"))turtle.update() # 刷新turtle.hideturtle() # 隐藏光标turtle.update() # 刷新turtle.done() # 结束绘制

若有收获,就点个赞吧
0 人点赞
