legend 在英语里面的含义就是图示的说明,legend 主要的作用是解释一下我们坐标轴里面的图形的含义,表明每个函数是什么样的曲线等等。
pyplot.legend(*args, **kwargs)legend()legend(handles, labels)legend(handles=handles)legend(labels)
参数:
handles:sequence of Artist,添加到图中的线条列表,与标签长度应相同,长度不同时,将截断为较小的长度
labels:list of str, optional,显示的标签列表
返回值:Legend
matplotlib.legend.Legend(parent, handles, labels, loc=None, numpoints=None,markerscale=None, markerfirst=True, scatterpoints=None,scatteryoffsets=None, prop=None, fontsize=None,labelcolor=None, borderpad=None, labelspacing=None,handlelength=None, handleheight=None, handletextpad=None,borderaxespad=None, columnspacing=None, ncol=1, mode=None,fancybox=None, shadow=None, title=None, title_fontsize=None,framealpha=None, edgecolor=None, facecolor=None,bbox_to_anchor=None, bbox_transform=None, frameon=None,handler_map=None, title_fontproperties=None)
主要参数:
parent:Axes or Figure,包含Legend的曲线.
handles:list of Artist,将加到 legend中的曲线的列表
labels:list of str,将显示的标签列表
其他参数
loc:str or pair of floats, 默认值: rcParams[“legend.loc”] (default: ‘best’) (‘best’ for axes, ‘upper right’ for figures)
Matplotlib中的legend()方法中使用 loc 这个参数来设定位置:
| 位置字符串 | 位置代码 |
|---|---|
| ‘best’ | 0 |
| ‘upper right’ | 1 |
| ‘upper left’ | 2 |
| ‘lower left’ | 3 |
| ‘lower right’ | 4 |
| ‘right’ | 5 |
| ‘center left’ | 6 |
| ‘center right’ | 7 |
| ‘lower center’ | 8 |
| ‘upper center’ | 9 |
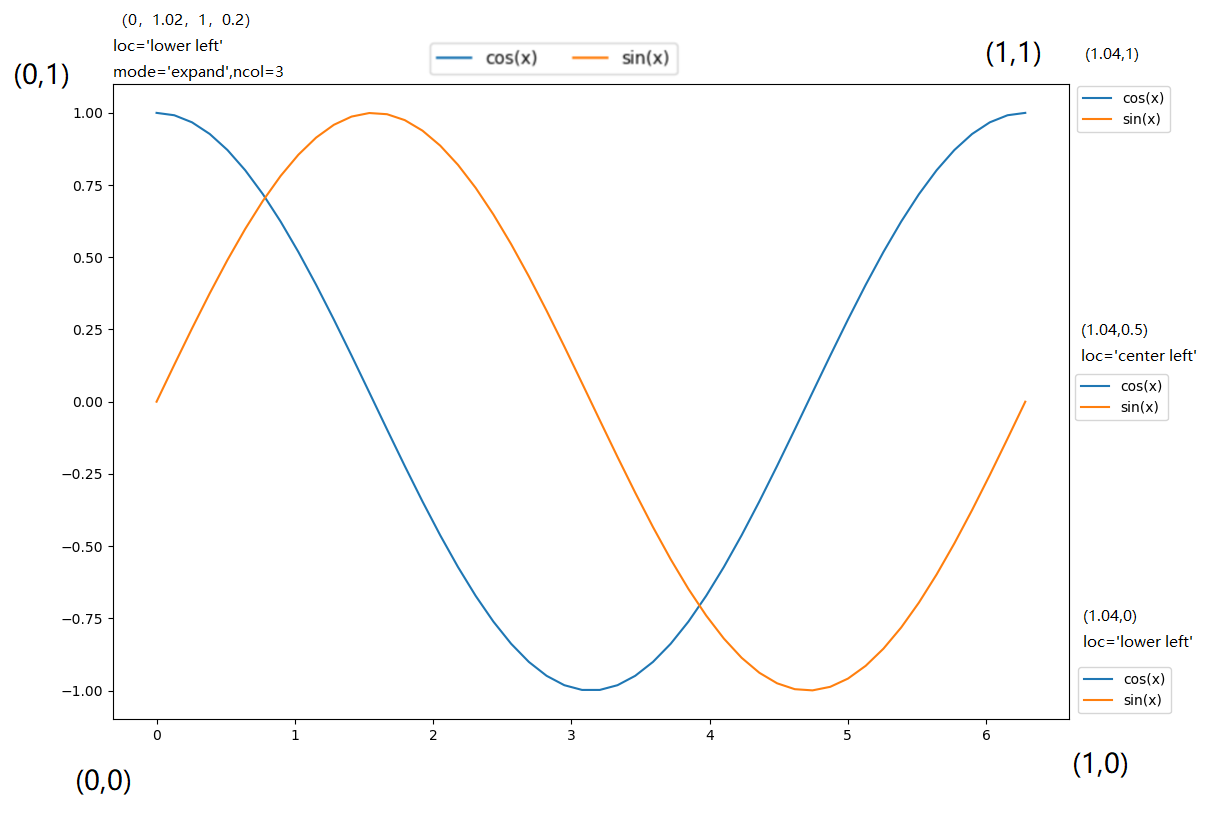
也可以用一个2元组,在轴坐标中给出图例左下角的x,y(在这种情况下,将忽略bboxto_anchor )。
bbox_to_anchor:BboxBase, 2-tuple, or 4-tuple of floats,浮点数组成的2-元组或4-元组_
Box是用于与loc一起定位图例的框。当调用的方法为 Axes.legend时默认为axes.bbox,当调用的方法是 Figure.legend时默认为figure.bbox。此参数允许任意放置图例。
Bbox坐标在Bbox_transform给定的坐标系中进行解释,默认的变换轴或图形坐标取决于调用哪个legend。
如果给定了4-元组或BboxBase,则它指定图例所在的bbox(x、y、宽度、高度)。
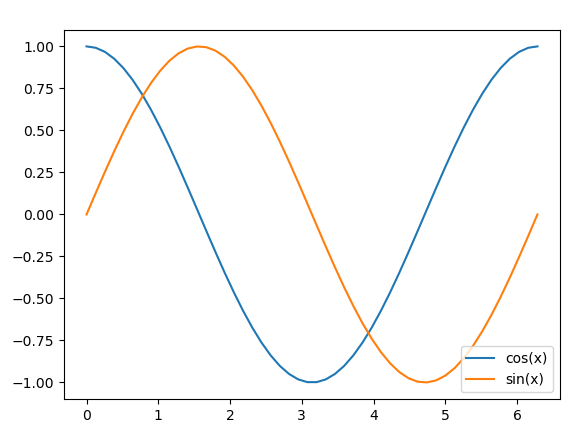
要将图例放置在轴(或图形)右下象限的最佳位置,可执行以下操作:
import matplotlib.pyplot as pltimport numpy as npfig, ax = plt.subplots()x = np.linspace(0, 2 * np.pi)cos_x, = plt.plot(x, np.cos(x), label="cos(x)")sin_x, = plt.plot(x, np.sin(x), label="sin(x)")ax.legend(loc='best', bbox_to_anchor=(0.5, 0., 0.5, 0.5))# ax.legend(loc='center', bbox_to_anchor=(0, -0.06, 1, -0.06),ncol=2)# ax.legend(loc='center', bbox_to_anchor=(0, 1.02, 1, 0.1),ncol=2)# ax.legend(loc='center left', bbox_to_anchor=(1.00, 0.5, 1.00, 0.5))plt.show()
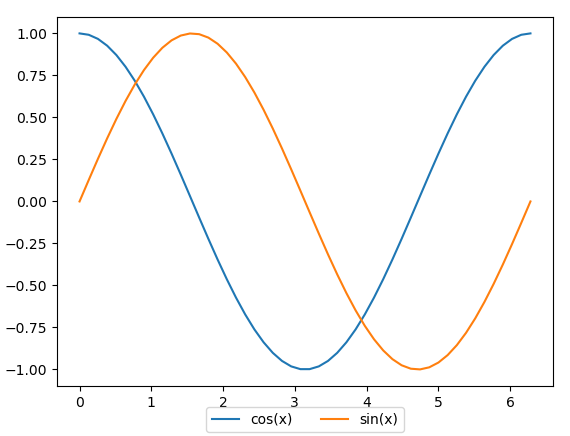
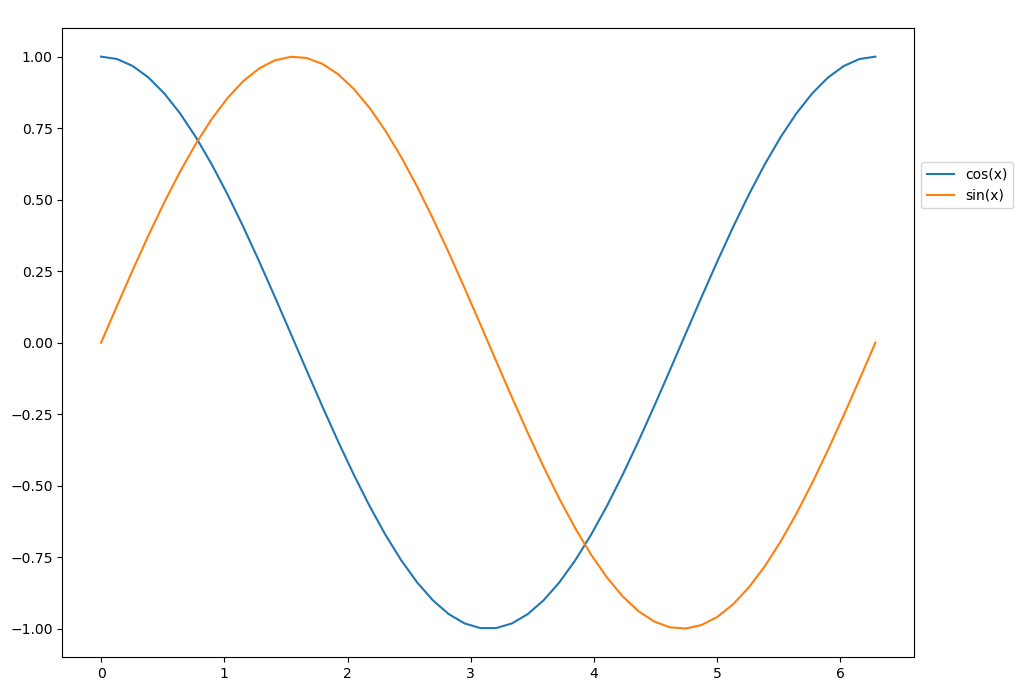
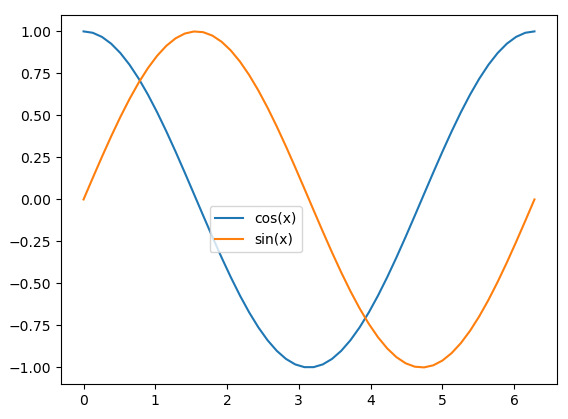
2-元组(x,y)将loc指定的图例的角放置在x,y。例如,要将图例的右上角放置在轴(或图)的中心,可以使用以下关键字:
import matplotlib.pyplot as pltimport numpy as npfig, ax = plt.subplots()x = np.linspace(0, 2 * np.pi)cos_x, = plt.plot(x, np.cos(x), label="cos(x)")sin_x, = plt.plot(x, np.sin(x), label="sin(x)")ax.legend(loc='upper right', bbox_to_anchor=(0.5, 0.5))plt.show()
ncol:int, 默认值 : 1,图例分几列放置
prop:None or matplotlib.font_manager.FontProperties or dict
fontsize:int or {‘xx-small’, ‘x-small’, ‘small’, ‘medium’, ‘large’, ‘x-large’, ‘xx-large’}
labelcolor:str or list, default: rcParams[“legend.labelcolor”] (default: **‘None’**)
numpoints:int, default: rcParams[“legend.numpoints”] (default: 1)
scatterpoints:int, default: rcParams[“legend.scatterpoints”] (default: 1)
scatteryoffsets:iterable of floats, default: __[0.375, 0.5, 0.3125]
markerscale:float, default: rcParams[“legend.markerscale”] (default: 1.0)
markerfirst:bool, default: True
frameon:bool, default: rcParams[“legend.frameon”] (default: True)
fancybox:bool, default: rcParams[“legend.fancybox”] (default: True)
shadow:bool, default: rcParams[“legend.shadow”] (default: False)
framealpha:float, default: rcParams[“legend.framealpha”] (default: 0.8)
facecolor:“inherit” or color, default: rcParams[“legend.facecolor”] (default: ‘inherit’)
edgecolor:“inherit” or color, default: rcParams[“legend.edgecolor”] (default: ‘0.8’)
mode:{“expand”, None}
bboxtransform:_None or matplotlib.transforms.Transform
title:str or None
titlefontproperties:_None or matplotlib.font_manager.FontProperties or dict
titlefontsize:_int or {‘xx-small’, ‘x-small’, ‘small’, ‘medium’, ‘large’, ‘x-large’, ‘xx-large’}, default: rcParams[“legend.title_fontsize”] (default: None)
borderpad:float, default: rcParams[“legend.borderpad”] (default: 0.4)
labelspacing:float, default: rcParams[“legend.labelspacing”] (default: 0.5)
handlelength:float, default: rcParams[“legend.handlelength”] (default: 2.0)
handleheight:float, default: rcParams[“legend.handleheight”] (default: 0.7)
handletextpad:float, default: rcParams[“legend.handletextpad”] (default: 0.8)
borderaxespad:float, default: rcParams[“legend.borderaxespad”] (default: 0.5)
columnspacing:float, default: rcParams[“legend.columnspacing”] (default: 2.0)
handlermap:_dict or None
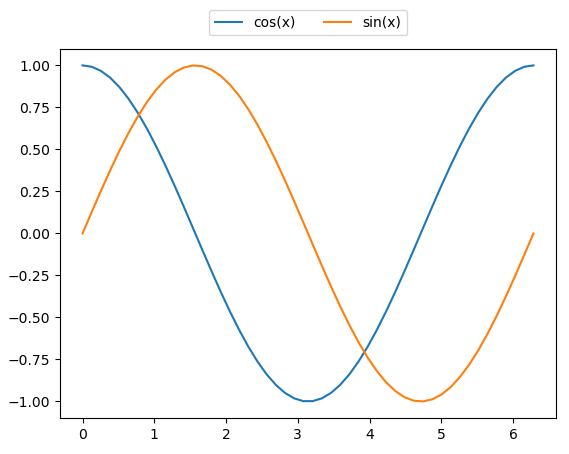
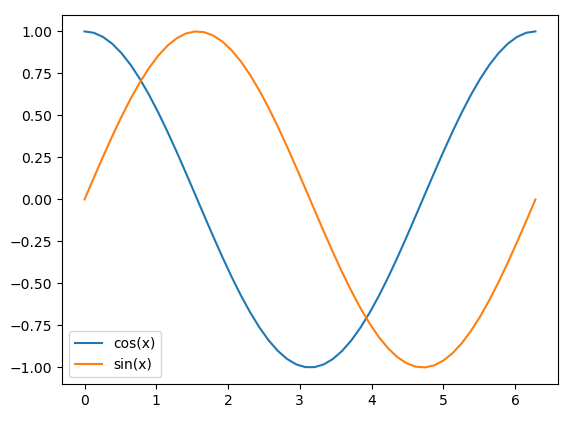
1.自动检测合适的位置
当不传入任何额外参数时,将自动确定要添加到图例中的元素的位置。
legend(labels)
import matplotlib.pyplot as pltimport numpy as npfig, ax = plt.subplots()x = np.linspace(0, 2 * np.pi)cos_x, = plt.plot(x, np.cos(x), label="cos(x)")sin_x, = plt.plot(x, np.sin(x), label="sin(x)")ax.legend()plt.show()
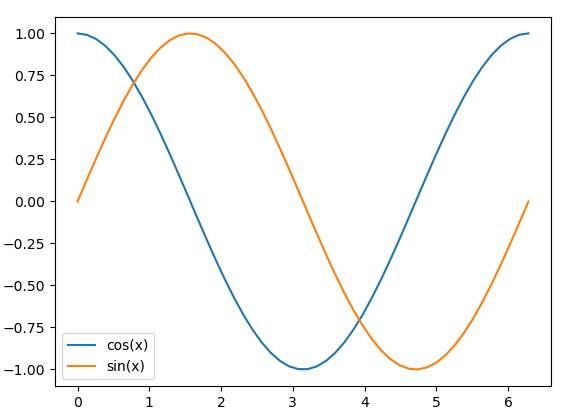
2.在legend图例中明确列出artists和标签
每条曲线都有一个标签时,可以传递可迭代的曲线名和对应的可迭代的标签:
ax.legend([line1, line2, line3], ['label1', 'label2', 'label3'])
import matplotlib.pyplot as pltimport numpy as npfig, ax = plt.subplots()x = np.linspace(0, 2 * np.pi)cos_x, = plt.plot(x, np.cos(x), label="cos(x)")sin_x, = plt.plot(x, np.sin(x), label="sin(x)")ax.legend([cos_x, sin_x], ['cos(x)', 'sin(x)'])plt.show()
3.在legend图例中明确列出artists
与2类似,但标签取自曲线的属性值
import matplotlib.pyplot as pltimport numpy as npfig, ax = plt.subplots()x = np.linspace(0, 2 * np.pi)cos_x, = plt.plot(x, np.cos(x), label="cos(x)")sin_x, = plt.plot(x, np.sin(x), label="sin(x)")ax.legend(handles=[cos_x, sin_x])plt.show()
4.标记现有绘图元素
依次标记各条曲线
import matplotlib.pyplot as pltimport numpy as npfig, ax = plt.subplots()x = np.linspace(0, 2 * np.pi)cos_x, = plt.plot(x, np.cos(x), label="cos(x)")sin_x, = plt.plot(x, np.sin(x), label="sin(x)")ax.legend(['cos(x)', 'sin(x)'])plt.show()
[
](https://blog.csdn.net/chichoxian/article/details/101058046)

若有收获,就点个赞吧
0 人点赞
