Window Functions
import pandas as pdimport numpy as npimport matplotlib.pyplot as plts = pd.Series(np.random.randn(1000), index=pd.date_range('1/1/2000', periods=1000))s = s.cumsum()print(s)
2000-01-01 -1.502006
2000-01-02 -1.556376
2000-01-03 -1.984150
2000-01-04 -2.961085
2000-01-05 -4.666668
…
2002-09-22 -0.700717
2002-09-23 -0.425694
2002-09-24 -0.517709
2002-09-25 0.289343
2002-09-26 -0.047902
Freq: D, Length: 1000, dtype: float64
r = s.rolling(window=60)print(r)
Rolling [window=60,center=False,axis=0]
print(r.mean())
2000-01-01 NaN
2000-01-02 NaN
2000-01-03 NaN
2000-01-04 NaN
2000-01-05 NaN
…
2002-09-22 -40.112116
2002-09-23 -40.152337
2002-09-24 -40.208325
2002-09-25 -40.287791
2002-09-26 -40.298607
Freq: D, Length: 1000, dtype: float64
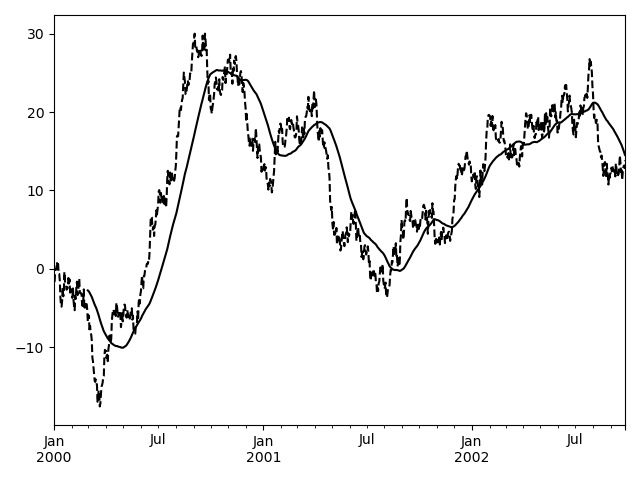
s.plot(style='k--')r.mean().plot(style='k')plt.show()
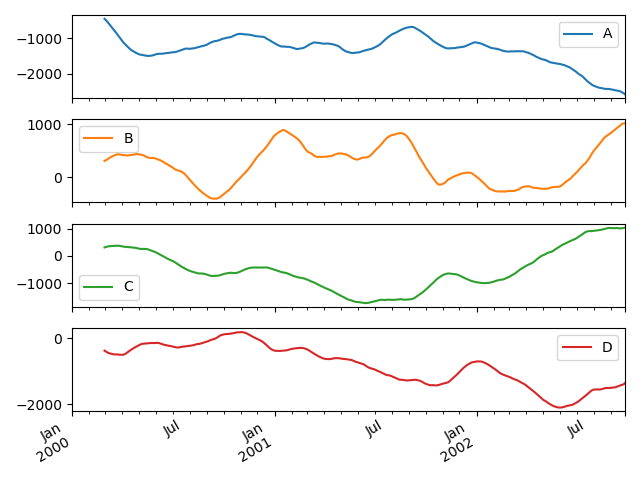
df = pd.DataFrame(np.random.randn(1000, 4),index=pd.date_range('1/1/2000', periods=1000),columns=['A', 'B', 'C', 'D'])df = df.cumsum()df.rolling(window=60).sum().plot(subplots=True)plt.show()
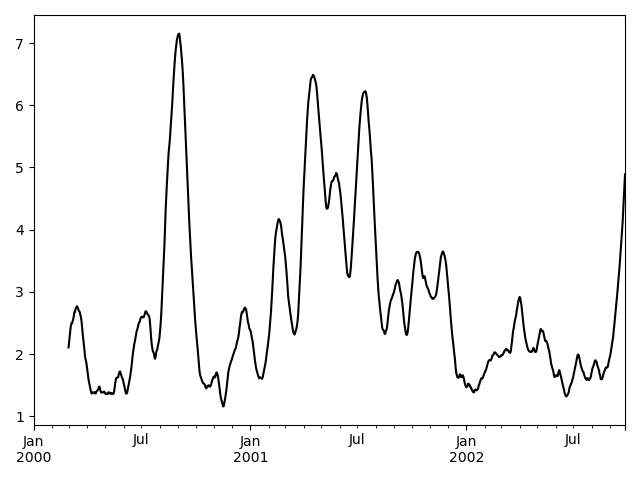
def mad(x):return np.fabs(x - x.mean()).mean()s.rolling(window=60).apply(mad, raw=True).plot(style='k')plt.show()

若有收获,就点个赞吧
0 人点赞
