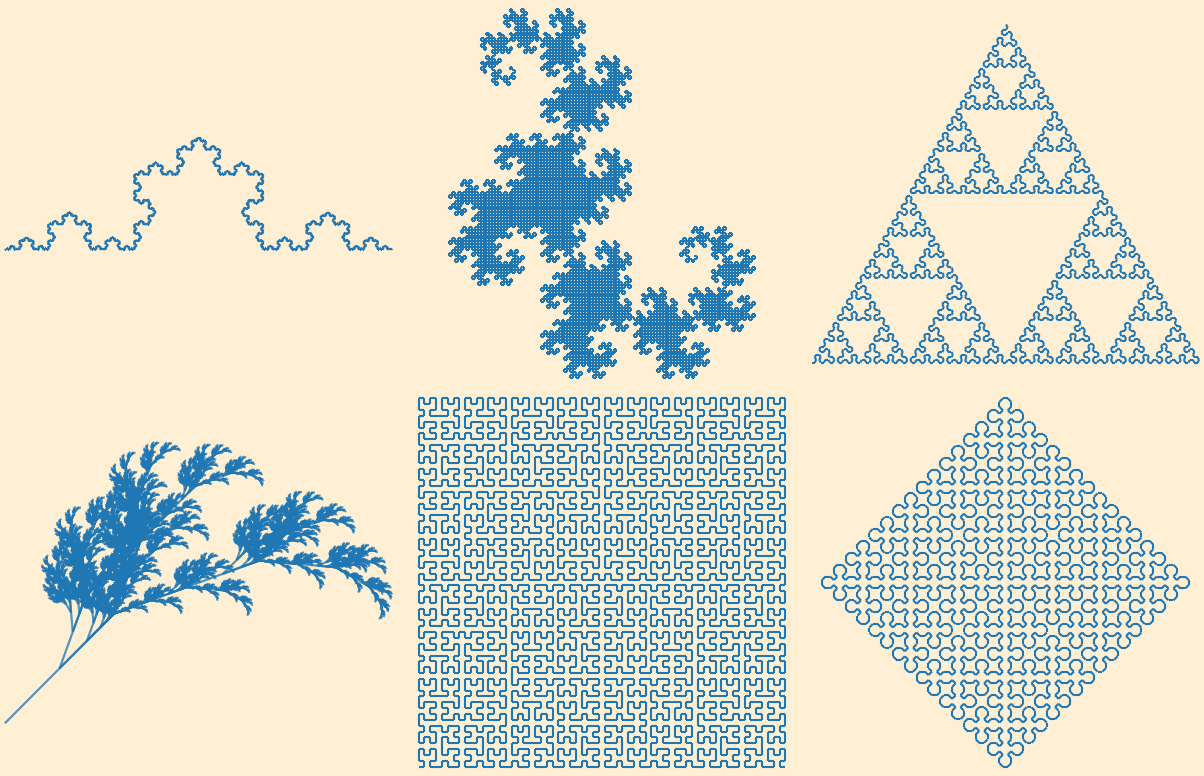
from math import sin, cos, piimport matplotlib.pyplot as plfrom matplotlib import collectionsclass L_System(object):def __init__(self, rule):info = rule['S']for i in range(rule['iter']):ninfo = []for c in info:if c in rule:ninfo.append(rule[c])else:ninfo.append(c)info = "".join(ninfo)self.rule = ruleself.info = infodef get_lines(self):d = self.rule['direct']a = self.rule['angle']p = (0.0, 0.0)l = 1.0lines = []stack = []for c in self.info:if c in "Ff":r = d * pi / 180t = p[0] + l * cos(r), p[1] + l * sin(r)lines.append(((p[0], p[1]), (t[0], t[1])))p = telif c == "+":d += aelif c == "-":d -= aelif c == "[":stack.append((p, d))elif c == "]":p, d = stack[-1]del stack[-1]return linesrules = [{"F": "F+F--F+F", "S": "F","direct": 180,"angle": 60,"iter": 8,"title": "Koch"},{"X": "X+YF+", "Y": "-FX-Y", "S": "FX","direct": 0,"angle": 90,"iter": 13,"title": "Dragon"},{"f": "F-f-F", "F": "f+F+f", "S": "f","direct": 0,"angle": 60,"iter": 7,"title": "Triangle"},{"X": "F-[[X]+X]+F[+FX]-X", "F": "FF", "S": "X","direct": -45,"angle": 25,"iter": 8,"title": "Plant"},{"S": "X", "X": "-YF+XFX+FY-", "Y": "+XF-YFY-FX+","direct": 0,"angle": 90,"iter": 6,"title": "Hilbert"},{"S": "L--F--L--F", "L": "+R-F-R+", "R": "-L+F+L-","direct": 0,"angle": 45,"iter": 10,"title": "Sierpinski"},]def draw(ax, rule, iter=None):if iter != None:rule["iter"] = iterlines = L_System(rule).get_lines()linecollections = collections.LineCollection(lines)ax.add_collection(linecollections, autolim=True)ax.axis("equal")ax.set_axis_off()ax.set_xlim(ax.dataLim.xmin, ax.dataLim.xmax)ax.invert_yaxis()fig = pl.figure(figsize=(7, 4.5))fig.patch.set_facecolor("papayawhip")for i in range(6):ax = fig.add_subplot(231 + i)draw(ax, rules[i])help(ax.add_collection)fig.subplots_adjust(left=0, right=1, bottom=0, top=1, wspace=0, hspace=0)pl.show()
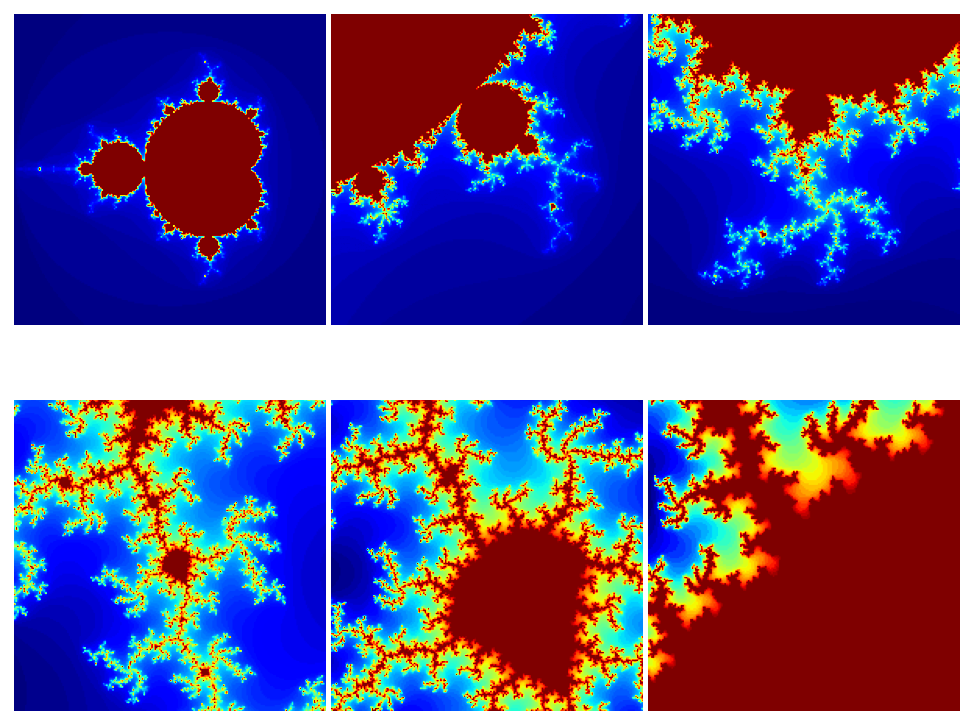
import numpy as npimport pylab as plfrom matplotlib import cmdef iter_point(c):z = cfor i in range(1, 100): # 最多迭代100次if abs(z) > 2:break # 半径大于2则认为逃逸z = z * z + creturn i # 返回迭代次数def draw_mandelbrot(cx, cy, d):""" 绘制点(cx, cy)附近正负d的范围的Mandelbrot """x0, x1, y0, y1 = cx - d, cx + d, cy - d, cy + dy, x = np.ogrid[y0:y1:200j, x0:x1:200j]c = x + y * 1jmandelbrot = np.frompyfunc(iter_point, 1, 1)(c).astype(np.float)pl.imshow(mandelbrot, cmap=cm.jet, extent=[x0, x1, y0, y1])pl.gca().set_axis_off()x, y = 0.27322626, 0.595153338pl.subplot(231)draw_mandelbrot(-0.5, 0, 1.5)for i in range(2, 7):pl.subplot(230 + i)draw_mandelbrot(x, y, 0.2 ** (i - 1))pl.subplots_adjust(0.02, 0, 0.98, 1, 0.02, 0)pl.show()

若有收获,就点个赞吧
0 人点赞
