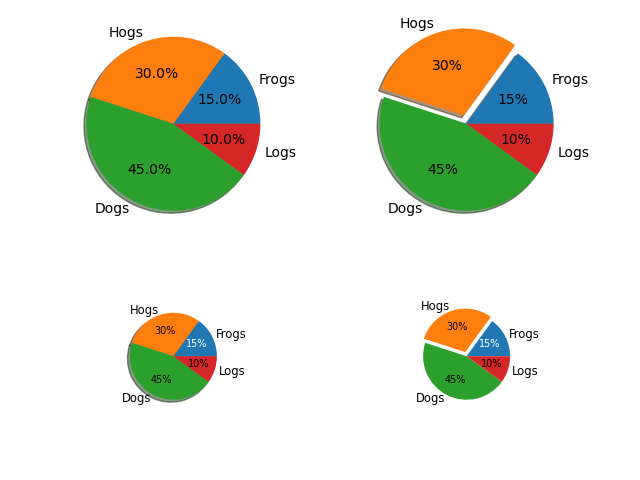
此示例演示一些饼图功能,如标签、可变大小、自动标记百分比、偏移切片和添加阴影。
import matplotlib.pyplot as plt# 设置数据labels = ['Frogs', 'Hogs', 'Dogs', 'Logs']fracs = [15, 30, 45, 10]# 制作图形和轴fig, axs = plt.subplots(2, 2)# 绘制标准饼图axs[0, 0].pie(fracs, labels=labels, autopct='%1.1f%%', shadow=True)# 用explode突出显示第二项axs[0, 1].pie(fracs, labels=labels, autopct='%.0f%%', shadow=True,explode=(0, 0.1, 0, 0))# 调整半径和文字大小绘制patches, texts, autotexts = axs[1, 0].pie(fracs, labels=labels,autopct='%.0f%%',textprops={'size': 'smaller'},shadow=True, radius=0.5)# 使文字更小plt.setp(autotexts, size='x-small')autotexts[0].set_color('white')# 使用较小的突出和关闭阴影以获得更好的可见性patches, texts, autotexts = axs[1, 1].pie(fracs, labels=labels,autopct='%.0f%%',textprops={'size': 'smaller'},shadow=False, radius=0.5,explode=(0, 0.05, 0, 0))plt.setp(autotexts, size='x-small')autotexts[0].set_color('white')plt.show()

若有收获,就点个赞吧
0 人点赞
