class pyecharts.charts.Page
class Page(# HTML 标题page_title: str = "Awesome-pyecharts",# 远程 HOST,默认为 "https://assets.pyecharts.org/assets/"js_host: str = "",# 每个图例之间的间隔interval: int = 1,# 布局配置项,参考 `PageLayoutOpts`layout: Union[PageLayoutOpts, dict] = PageLayoutOpts())
func pyecharts.charts.Page.add
def add(*charts) # charts: 任意图表实例
class pyecharts.options.PageLayoutOpts
class PageLayoutOpts(# 配置均为原生 CSS 样式justify_content: Optional[str] = None,margin: Optional[str] = None,display: Optional[str] = None,flex_wrap: Optional[str] = None,)
func pyecharts.charts.Page.save_resize_html
用于 DraggablePageLayout 布局重新渲染图表
def save_resize_html(# Page 第一次渲染后的 html 文件source: str = "render.html",*,# 布局配置文件cfg_file: types.Optional[str] = None,# 布局配置 dictcfg_dict: types.Optional[list] = None,# 重新生成的 .html 存放路径dest: str = "resize_render.html",) -> str
Page 内置了以下布局
- SimplePageLayout
- DraggablePageLayout
默认布局
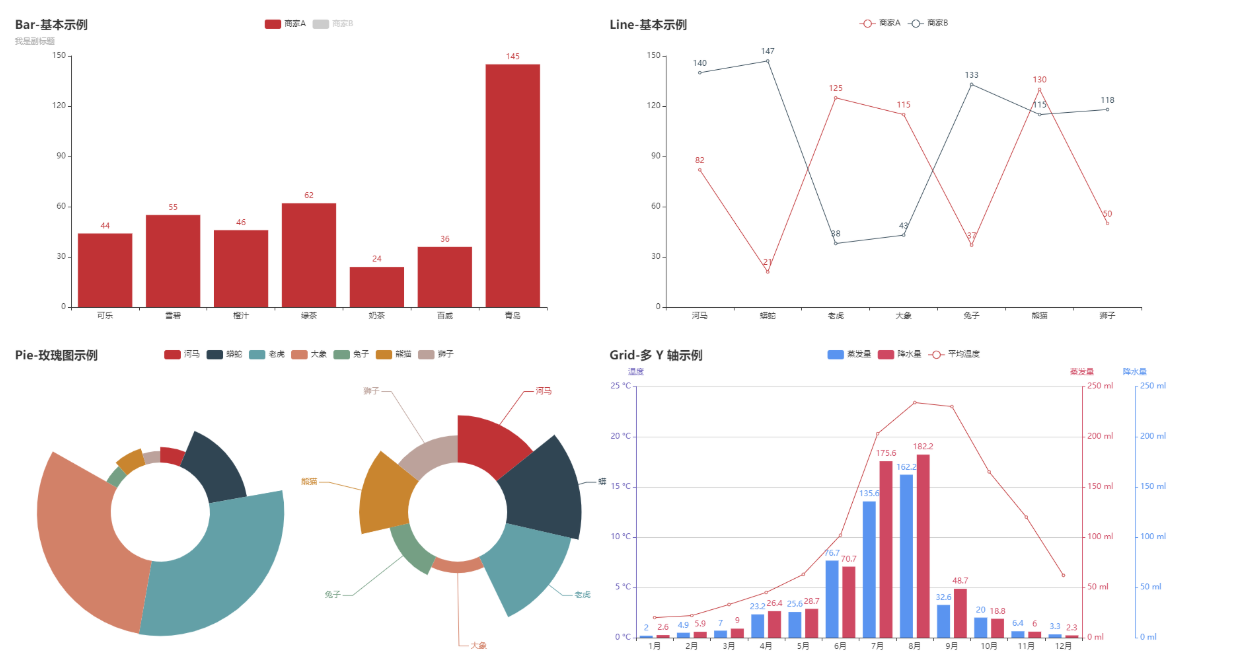
page = Page()page.add(bar_datazoom_slider(), line_markpoint(), pie_rosetype(), grid_mutil_yaxis())page.render()
SimplePageLayout 布局
page = Page(layout=Page.SimplePageLayout)# 需要自行调整每个 chart 的 height/width,显示效果在不同的显示器上可能不同page.add(bar_datazoom_slider(), line_markpoint(), pie_rosetype(), grid_mutil_yaxis())page.render()
DraggablePageLayout 布局
page = Page(layout=Page.DraggablePageLayout)page.add(bar_datazoom_slider(), line_markpoint(), pie_rosetype(), grid_mutil_yaxis())page.render()
Note: DraggablePageLayout 需要 pyecharts 版本 v.1.4.0+
# DraggablePageLayout 利用 Jquery 以及 Echarts 本身的 resize 功能,实现了可拖拽布局。使用步骤如下# 1.指定 Page 布局page = Page(layout=Page.DraggablePageLayout)# 正常 render 图表page.add(bar_datazoom_slider(), line_markpoint(), pie_rosetype(), grid_mutil_yaxis())page.render()# 使用浏览器打开渲染后的 .html 文件,默认为 render.html。拖拉/调整图表位置和大小,当调整到一个适合# 的布局时,点击左上方的 `Save Config` 按钮,下载 chart_config.json 配置文件,假设存放位置为# ~/chart_config.json。再次渲染图表并指定其布局配置# Warning: 请注释掉上面的的所有渲染代码,就是以下三行。因为 html 已经生成,并不需要再重新渲染一遍。# page = Page(layout=Page.DraggablePageLayout)# page.add(bar_datazoom_slider(), line_markpoint(), pie_rosetype(), grid_mutil_yaxis())# page.render()# render.html:第一步生成的原 html 文件# chart_config.json:第二步下载的配置文件# my_new_charts.html:新 html 文件路径Page.save_resize_html("render.html", cfg_file="~/chart_config.json", dest="my_new_charts.html")# 或者可以使用 json 数据# cfg_dict 为 json 文件里面的内容Page.save_resize_html("render.html", cfg_dict=cfg_dict, dest="my_new_charts.html")# Question:能否复用渲染模板?# Answer: 可以的,渲染配置 json 数据中是以 chart_id 来作为一个图形的唯一标识符的,所以只需要在# 第一次渲染的时候指定 chart_id 就可以啦。# example:# bar = bar_datazoom_slider()# bar.chart_id = "chenjiandongx_is_an_awesome_boy"# line = line_markpoint()# line.chart_id = "chenjiandongx_is_an_amazing_boy"# pie = pie_rosetype()# pie.chart_id = "chenjiandongx_is_an_adorable_boy"# 然后只要以后都按这个 chart_id 来渲染图表的时候,你的布局配置就可以复用啦。# cat chart_config.json,会发现 chart_id 是固定的啦。page.add(bar_datazoom_slider(), line_markpoint(), pie_rosetype()))
_

若有收获,就点个赞吧
0 人点赞
