VS
概述
在本教程中,我们将介绍如何将 Quarto 与 VS Code 配合使用。在开始之前,应安装 Quarto VS Code 扩展,其中包括许多增强 Quarto 使用的工具,包括:- 集成了 Quarto 文档的渲染和预览功能。
- Markdown 和嵌入式语言的语法高亮显示
- YAML 选项的完成和诊断
- 完成嵌入式语言(例如 Python、R、Julia 等)
- 用于运行单元格和选定行的命令和键绑定。
注意
本教程重点介绍如何在 VS Code 中编辑纯文本 Quarto 文件。根据您的偏好和手头的任务,Quarto 文档还有另外两种编辑模式:可视化编辑器和笔记本编辑器。出于学习目的,我们建议你使用 VS Code 文本编辑器完成本教程,然后在掌握基础知识后探索使用其他编辑模式。<font style="background-color:rgb(248, 249, 250);">.qmd</font>
### 基本工作流程
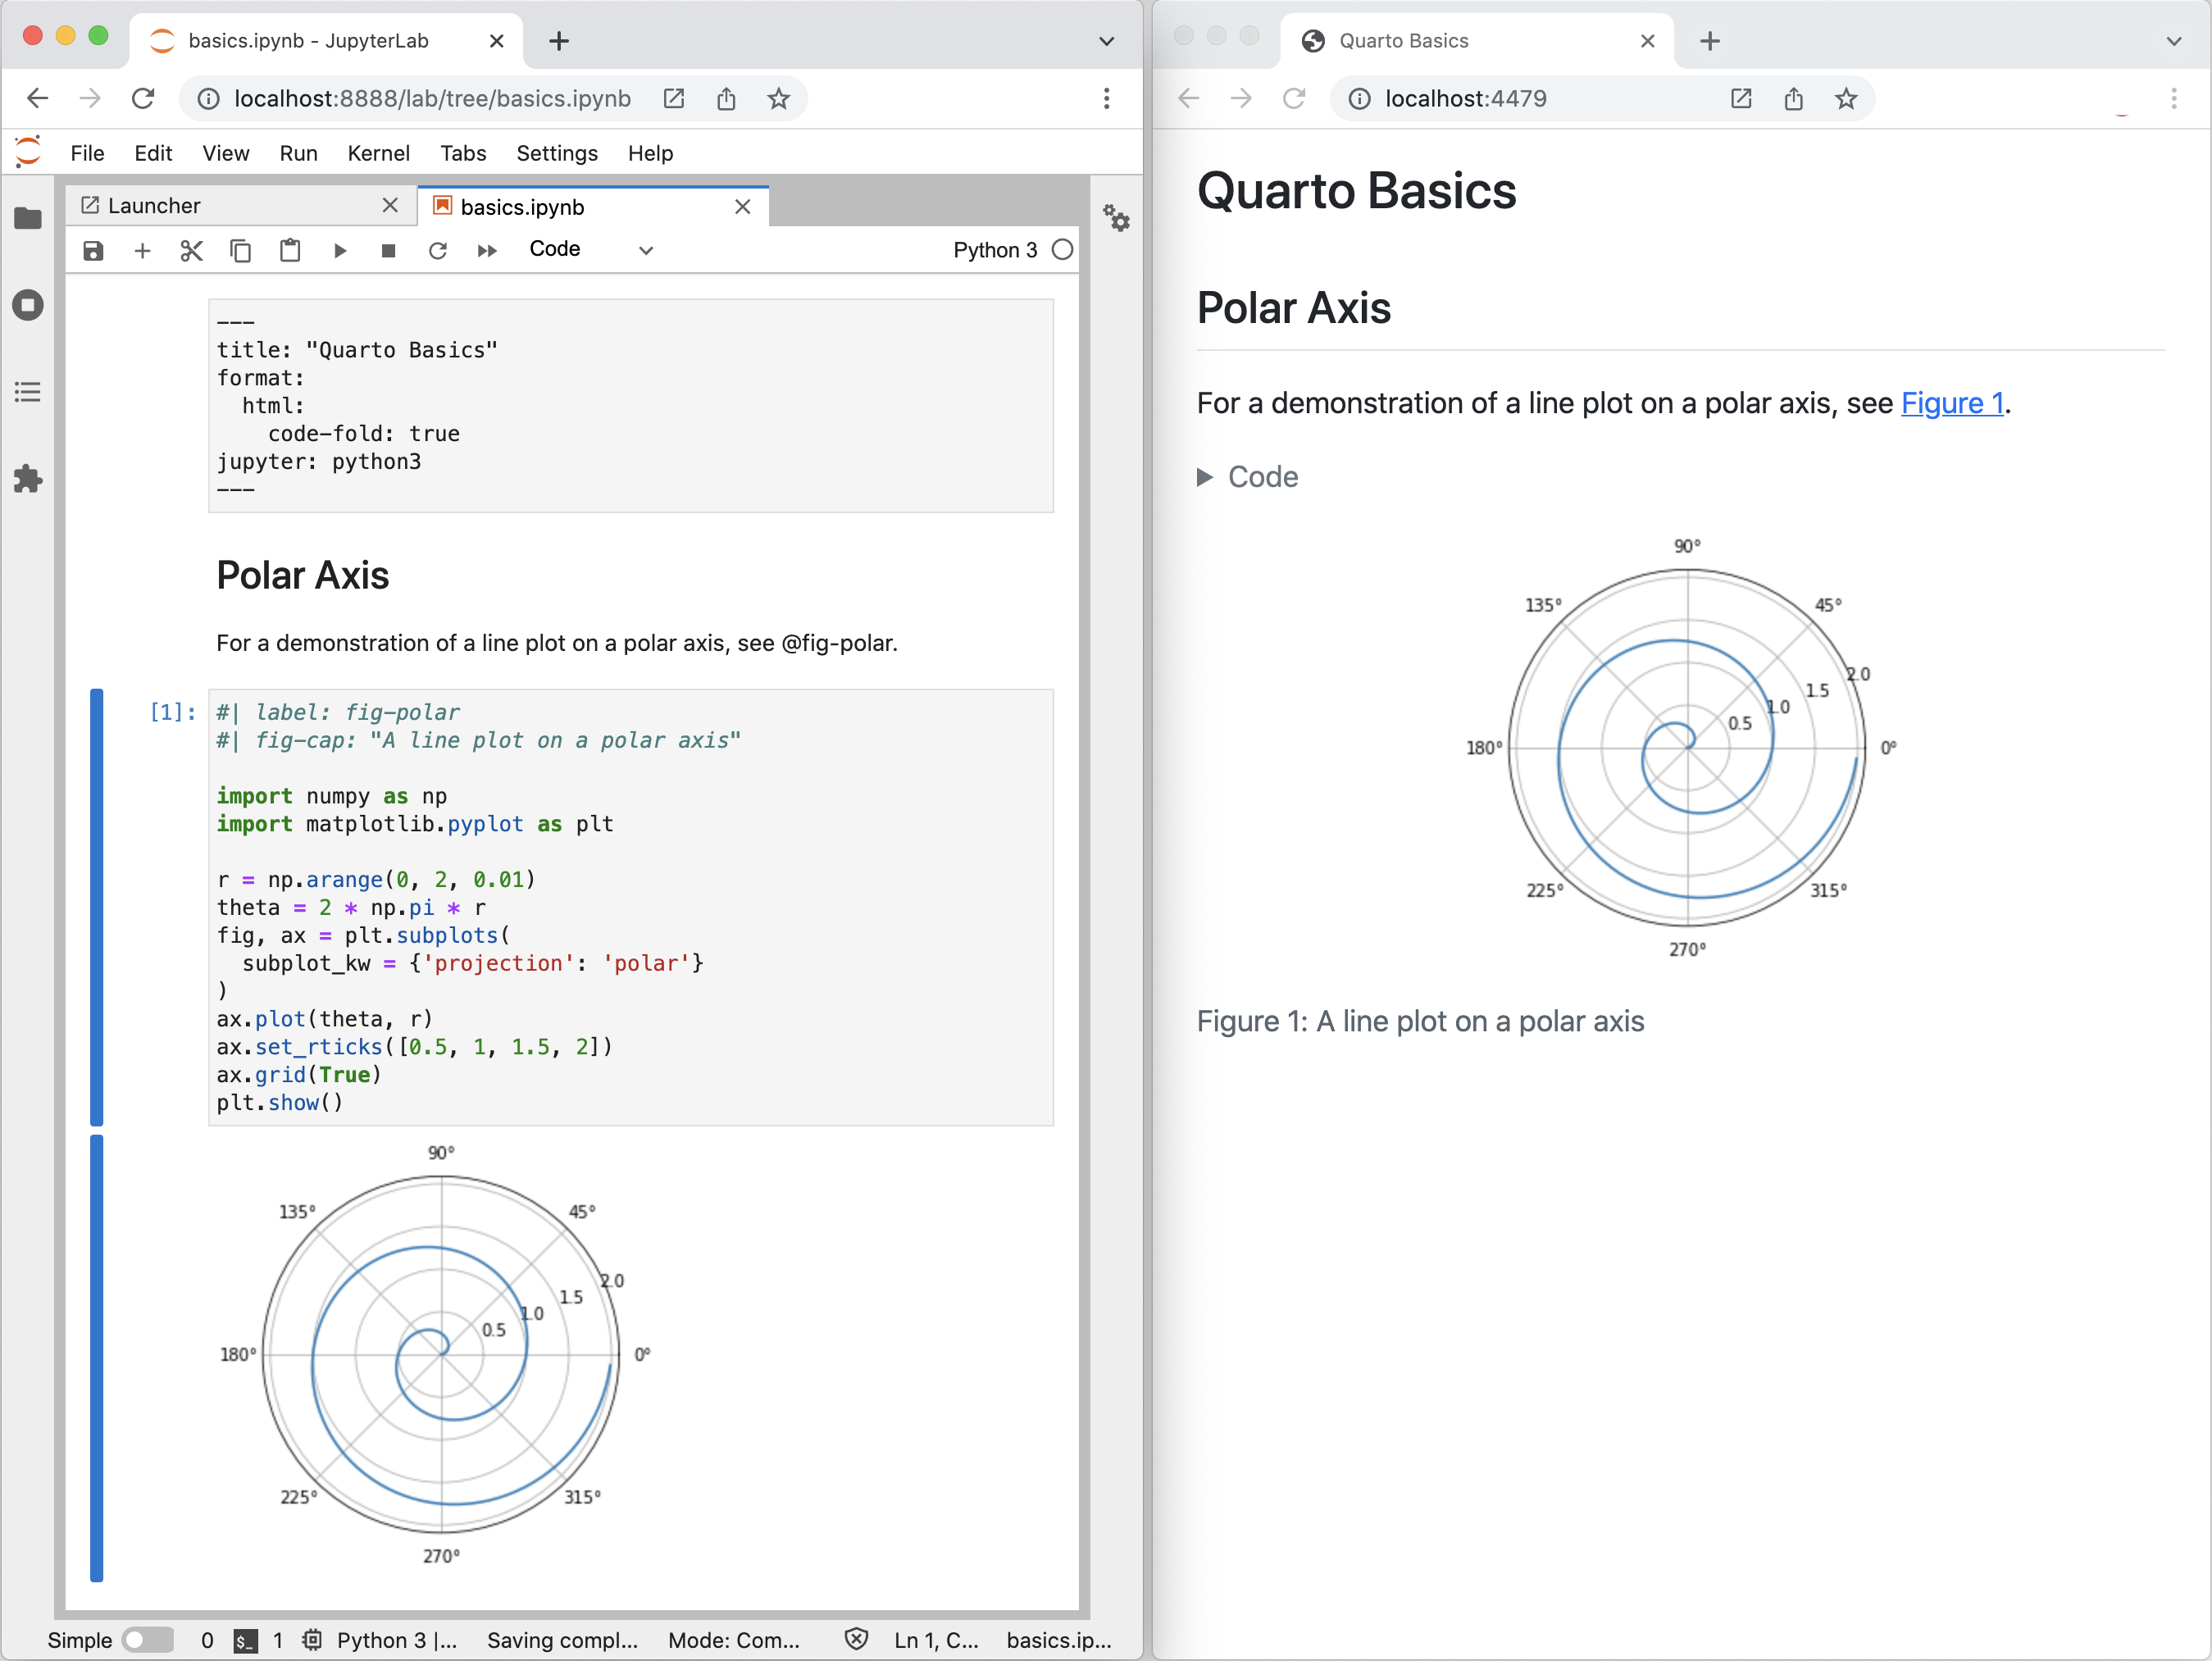
Quarto 文件包含 markdown 和可执行代码单元格的组合。下面是 VS Code 中编辑和预览文件的外观:Here’s what it might look like in VS Code to edit and preview a file:<font style="background-color:rgb(248, 249, 250);">.qmd</font>``<font style="background-color:rgb(248, 249, 250);">.qmd</font>
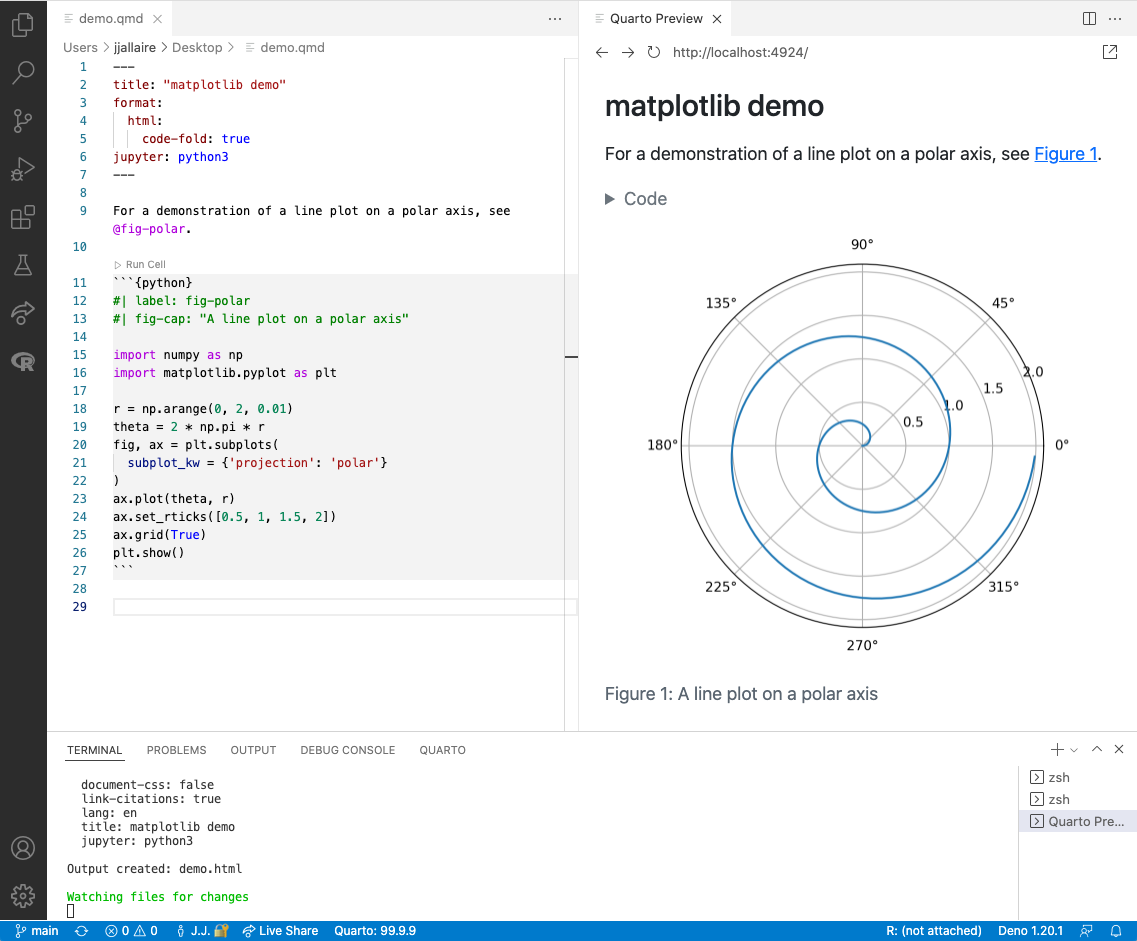 左边的文档将呈现为您在右边看到的 HTML 版本。这是 Quarto 出版的基本模型 - 获取源文档并将其呈现为各种输出格式,包括 HTML、PDF、MS Word 等。
这些教程将使用 和 Python 包,下表给出了可用于安装它们的命令。
左边的文档将呈现为您在右边看到的 HTML 版本。这是 Quarto 出版的基本模型 - 获取源文档并将其呈现为各种输出格式,包括 HTML、PDF、MS Word 等。
这些教程将使用 和 Python 包,下表给出了可用于安装它们的命令。<font style="background-color:rgb(248, 249, 250);">matplotlib</font>``<font style="background-color:rgb(248, 249, 250);">plotly</font>
| 平台 | 命令 |
| —- | —- |
| Mac/Linux操作系统 | Terminalpython3 -m pip install jupyter matplotlib plotly | | Windows | Terminal
py -m pip install jupyter matplotlib plotly | Note Note that while this tutorial uses Python, using Julia (via the IJulia kernel) is also well supported. See the article on Using Julia for additional details.
Render and Preview
We’ll start out by rendering a simple example () to a couple of formats. If you want to follow along step-by-step in your own environment, create a new file named and copy the following content into it.<font style="background-color:rgb(248, 249, 250);">hello.qmd</font>``<font style="background-color:rgb(248, 249, 250);">hello.qmd</font>
plain
---
title: "Quarto Basics"
format:
html:
code-fold: true
jupyter: python3
---
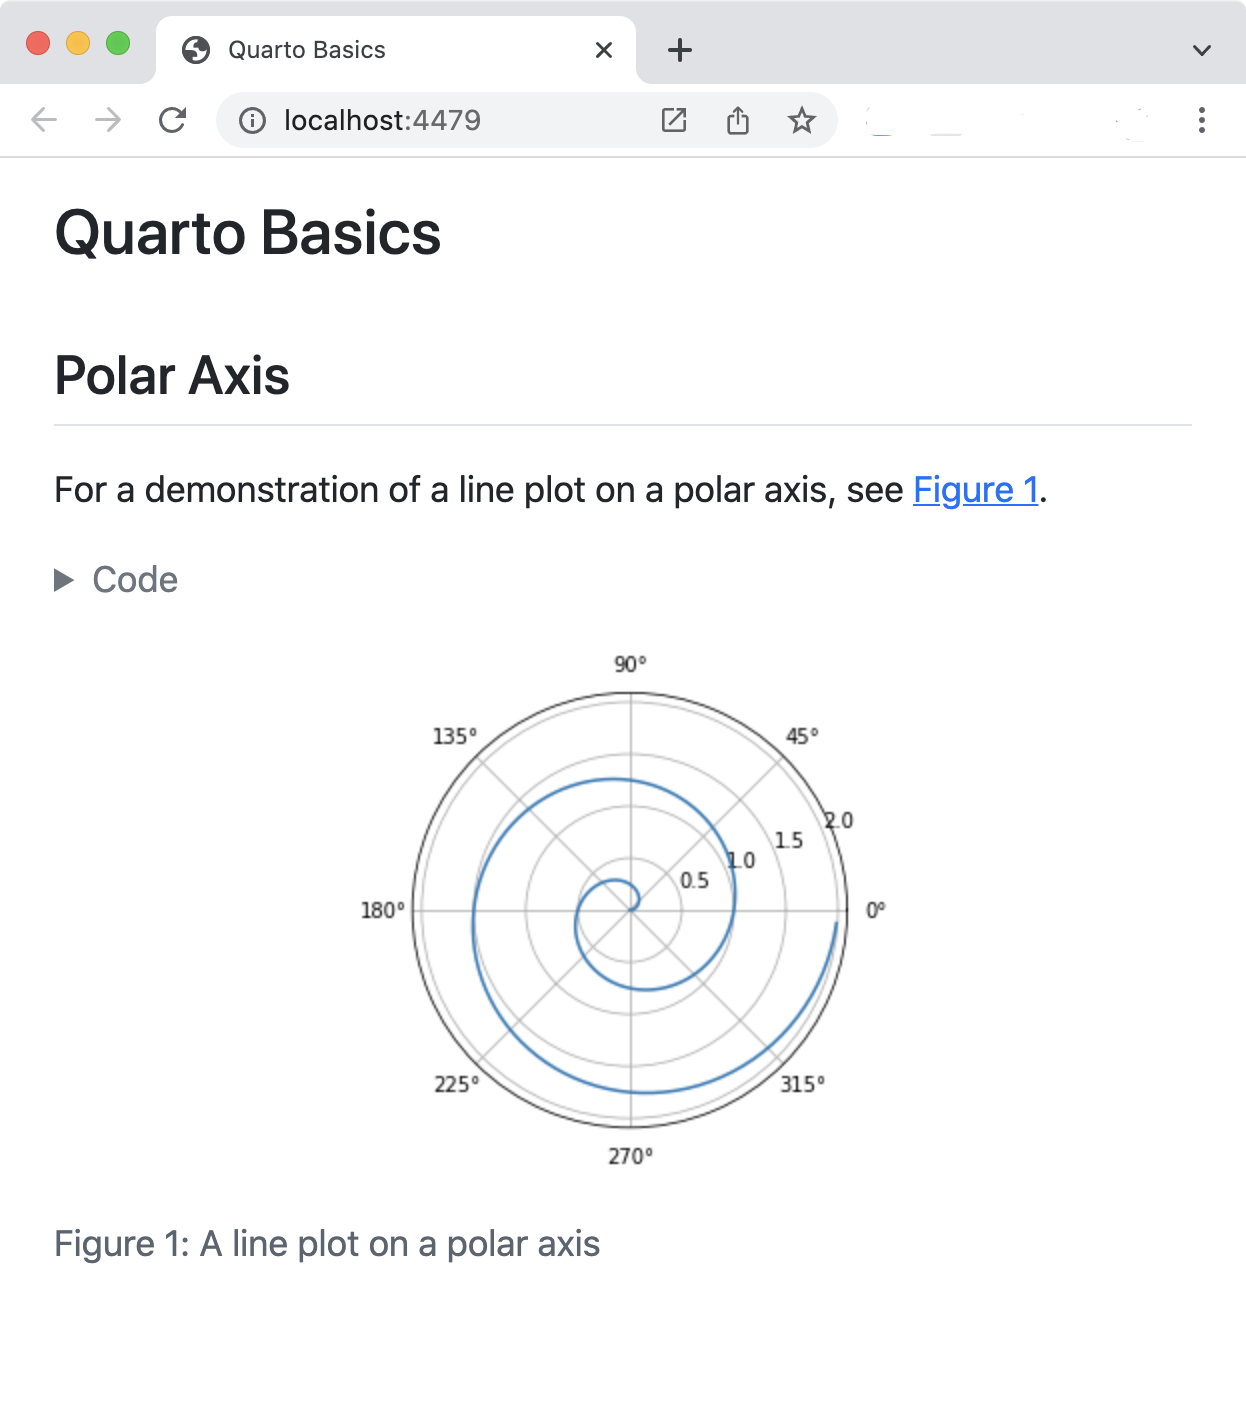
For a demonstration of a line plot on a polar axis, see @fig-polar.{python}
#| label: fig-polar
#| fig-cap: “A line plot on a polar axis”
import numpy as np
import matplotlib.pyplot as plt
r = np.arange(0, 2, 0.01)
theta = 2 np.pi r
fig, ax = plt.subplots(
subplot_kw = {‘projection’: ‘polar’}
)
ax.plot(theta, r)
ax.set_rticks([0.5, 1, 1.5, 2])
ax.grid(True)
plt.show()
请注意,如果您正在遵循以下操作,请务必安装所需的依赖项(如果尚未安装):
| 平台 | 命令 |
|---|---|
| Mac/Linux操作系统 | Terminal python3 -m pip install jupyter matplotlib plotly |
| 窗户 | Terminal py -m pip install jupyter matplotlib plotly |
 ):Ctrl+Shift+K
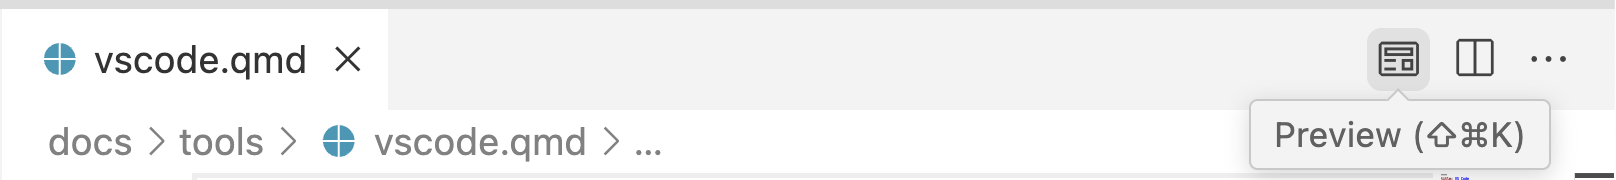
<font style="background-color:rgb(248, 249, 250);">Cmd</font>``<font style="background-color:rgb(248, 249, 250);">Ctrl</font>
### 它是如何工作的
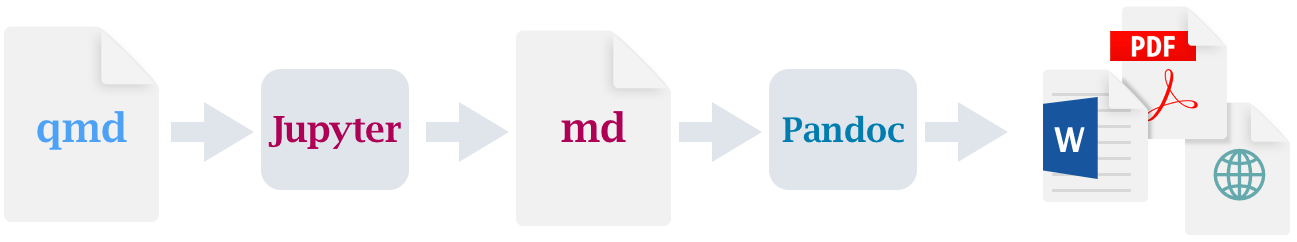
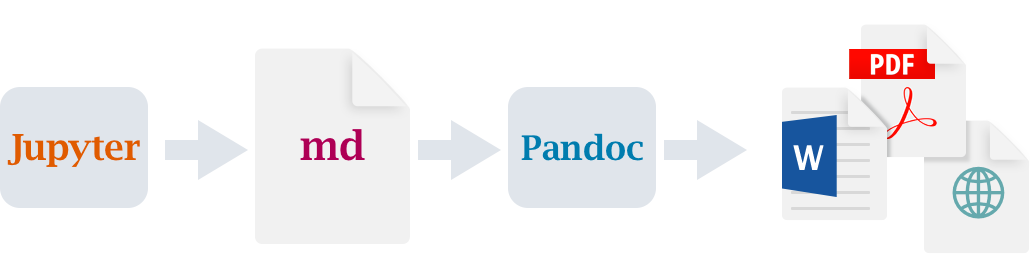
使用 Quarto 渲染文件时,Jupyter 会处理可执行代码块,并将生成的代码、Markdown 和输出组合转换为普通 Markdown。然后,Pandoc 会处理此 Markdown,从而创建完成的格式。<font style="background-color:rgb(248, 249, 250);">.qmd</font>
 ### 创作
让我们试着做一个小的改变,然后重新渲染:
### 创作
让我们试着做一个小的改变,然后重新渲染:
- 更改定义如下的代码行:
<font style="background-color:rgb(248, 249, 250);">theta</font>
- 重新渲染文件(使用 Quarto: Preview 或快捷方式) 文档已呈现,浏览器预览已更新。Ctrl+Shift+K
运行单元格
您无需完全呈现文档即可迭代代码单元格。您会注意到代码单元上方有一个“运行单元格”按钮。单击该按钮以执行单元格(输出在 Jupyter 交互式控制台中并排显示):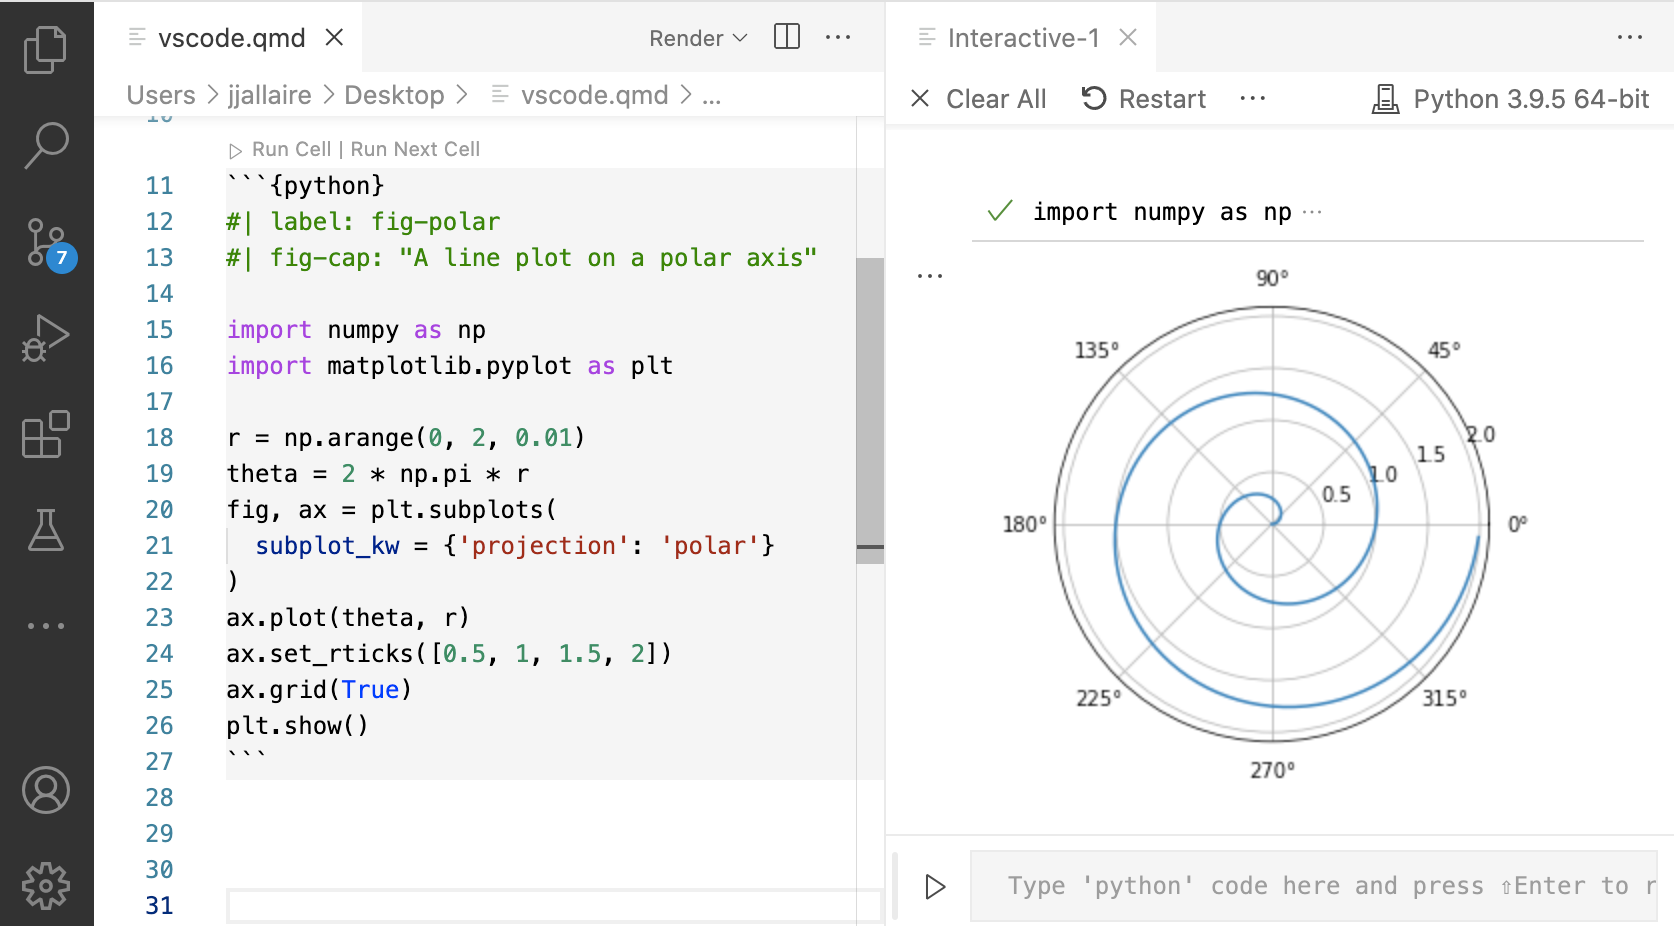
<font style="background-color:rgb(248, 249, 250);">Cmd</font>``<font style="background-color:rgb(248, 249, 250);">Ctrl</font>
中的内容有几种不同类型的,让我们对每种类型进行一些工作。<font style="background-color:rgb(248, 249, 250);">hello.qmd</font>
## YAML 选项
在文件的顶部有一个带有文档级别选项的 YAML 块。
尝试将选项更改为:
---title: "Quarto Basics"format:html:code-fold: truejupyter: python3---
<font style="background-color:rgb(248, 249, 250);">code-fold</font>``<font style="background-color:rgb(248, 249, 250);">false</font>
plain
format:
  html:
    code-fold: false
然后重新渲染文档(同样,渲染前无需保存)。您会注意到,代码现在显示在绘图上方,而以前它使用可用于显示它的代码按钮隐藏。
降价
叙述性内容是使用 Markdown 编写的。在这里,我们指定一个标题和对在下面代码单元中创建的图形的交叉引用。尝试更改页眉并重新呈现 - 预览将使用新的页眉文本进行更新。
## Polar AxisFor a demonstration of a line plot on a polar axis, see @fig-polar.
代码单元
代码单元包含要在渲染期间运行的可执行代码,输出(以及可选的代码)包含在渲染的文档中。
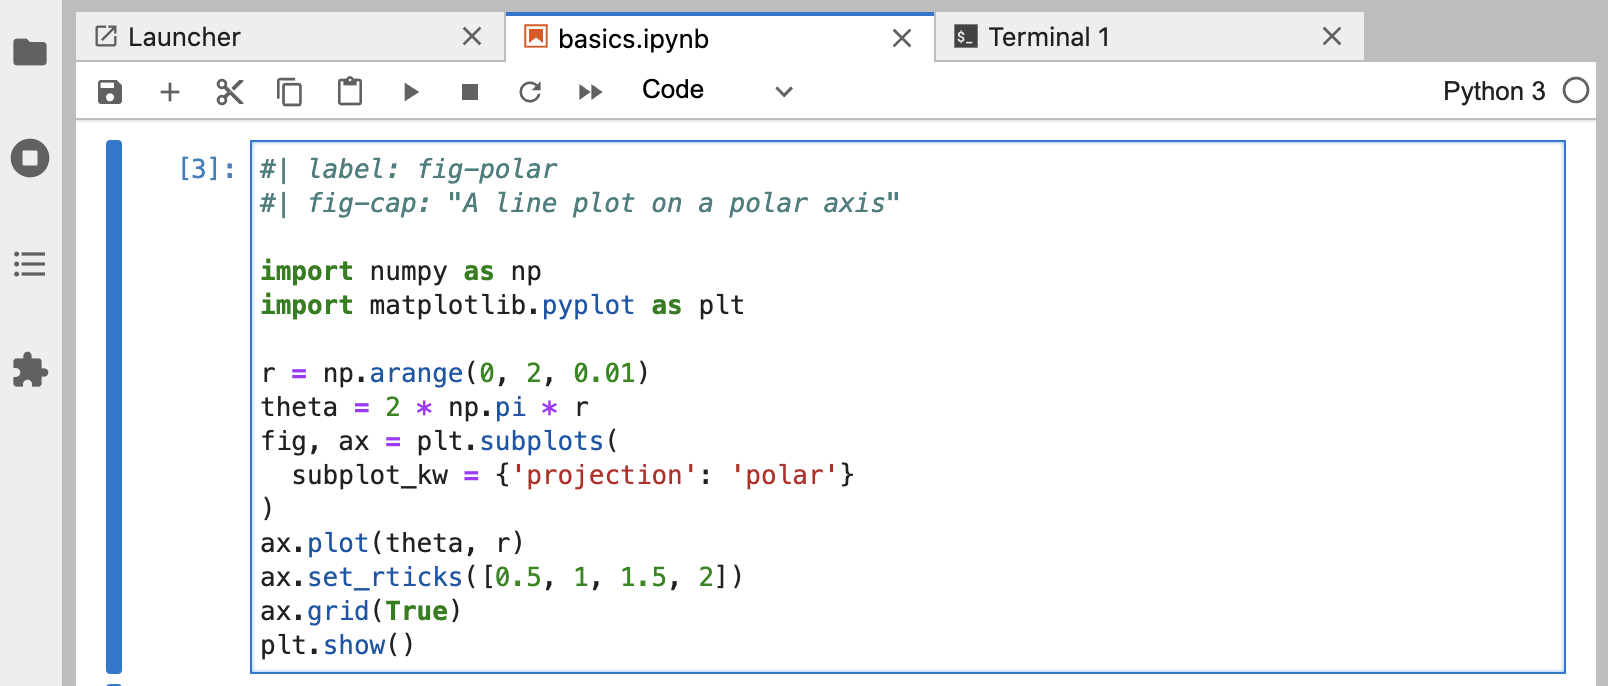
```{python}#| label: fig-polar#| fig-cap: "A line plot on a polar axis"import numpy as npimport matplotlib.pyplot as pltr = np.arange(0, 2, 0.01)theta = 2 * np.pi * rfig, ax = plt.subplots(subplot_kw = {'projection': 'polar'})ax.plot(theta, r)ax.set_rticks([0.5, 1, 1.5, 2])ax.grid(True)plt.show()
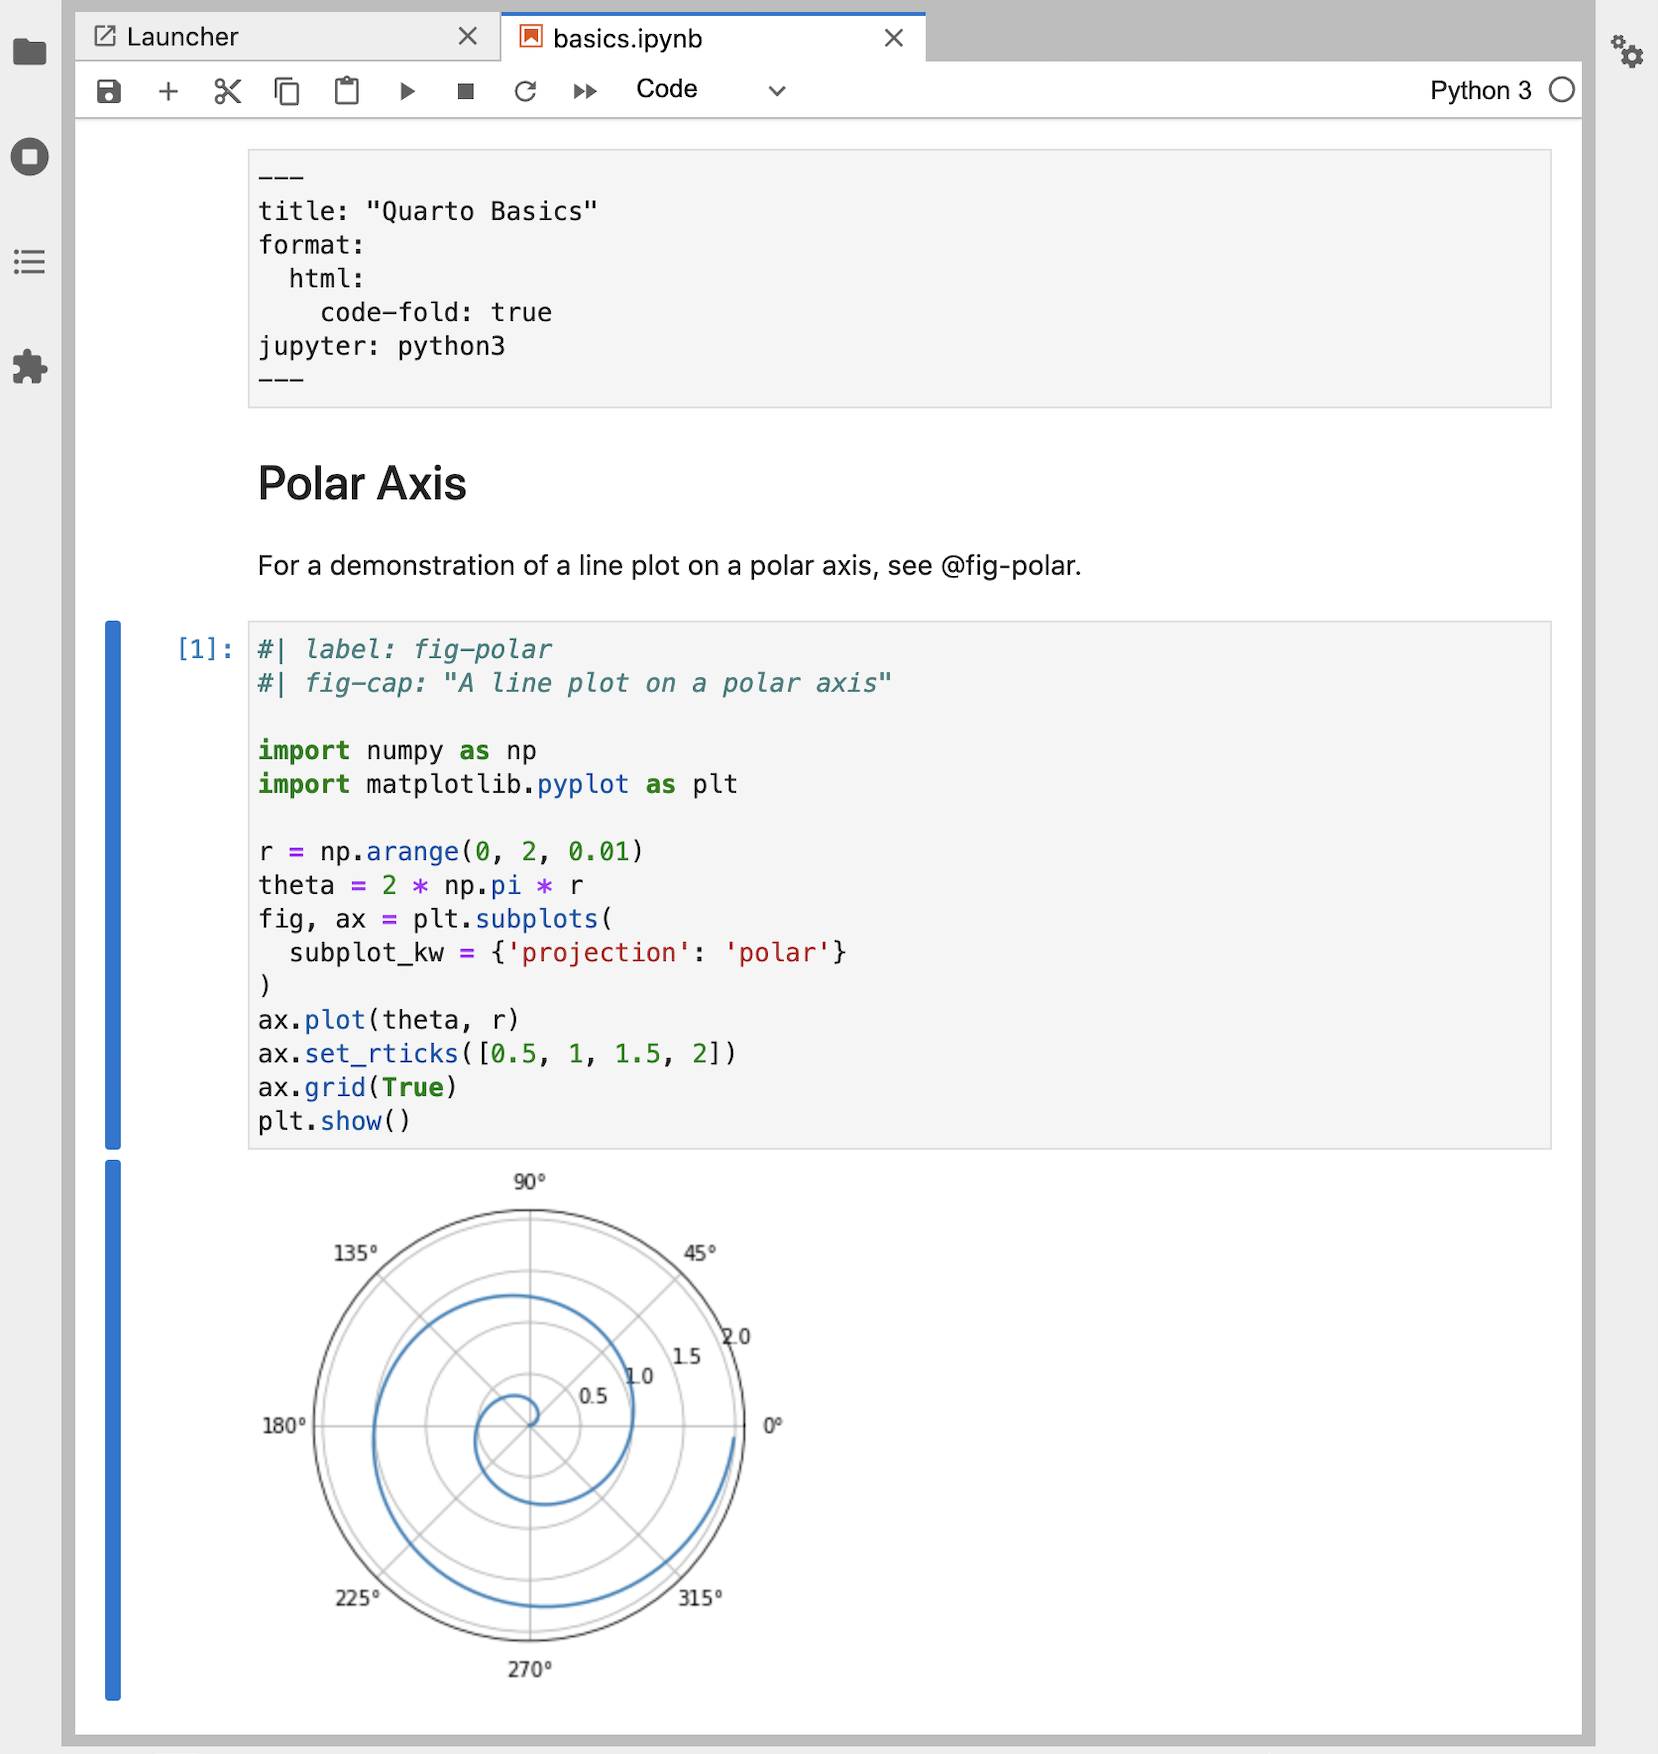
<font style="color:rgb(52, 58, 64);">您可能熟悉此处给出的 Matplotlib 代码。但是,代码单元格的顶部有一些不太熟悉的组件:和选项。单元格选项在 YAML 中使用特殊前缀的注释 () 编写。</font>`<font style="background-color:rgb(248, 249, 250);">label</font>``<font style="background-color:rgb(248, 249, 250);">fig-cap</font>``<font style="background-color:rgb(248, 249, 250);">#|</font>`<font style="color:rgb(52, 58, 64);">在此示例中,单元格选项用于使图形可交叉引用。尝试更改和/或代码,然后重新呈现以查看更新的预览。</font>`<font style="background-color:rgb(248, 249, 250);">fig-cap</font>`<font style="color:rgb(52, 58, 64);">您可以应用多种</font>[<font style="color:rgb(52, 58, 64);">单元格选项</font>](https://quarto.org/docs/reference/cells/cells-jupyter.html)<font style="color:rgb(52, 58, 64);">来定制输出。我们将在下一个教程中深入探讨这些选项。</font>**<font style="color:rgb(52, 58, 64);background-color:rgb(233, 242, 252);">注意</font>**<font style="color:rgb(52, 58, 64);">对于图形来说,一个特别有用的单元格选项是 ,它使您能够为有视力障碍的用户向图像添加替代文本。请参阅 Amy Cesal 关于</font>[<font style="color:rgb(52, 58, 64);">为数据可视化编写替代文本</font>](https://medium.com/nightingale/writing-alt-text-for-data-visualization-2a218ef43f81)<font style="color:rgb(52, 58, 64);">的文章以了解更多信息。</font>`<font style="background-color:rgb(248, 249, 250);">fig-alt</font>`## 外部预览<font style="color:rgb(52, 58, 64);">在本教程中,我们演示了如何在 VS Code 的窗格中预览呈现的输出。如果希望使用外部浏览器进行预览(或者完全不通过渲染触发预览),则可以使用</font>**<font style="color:rgb(52, 58, 64);">“预览类型</font>**<font style="color:rgb(52, 58, 64);">”选项指定替代行为:</font>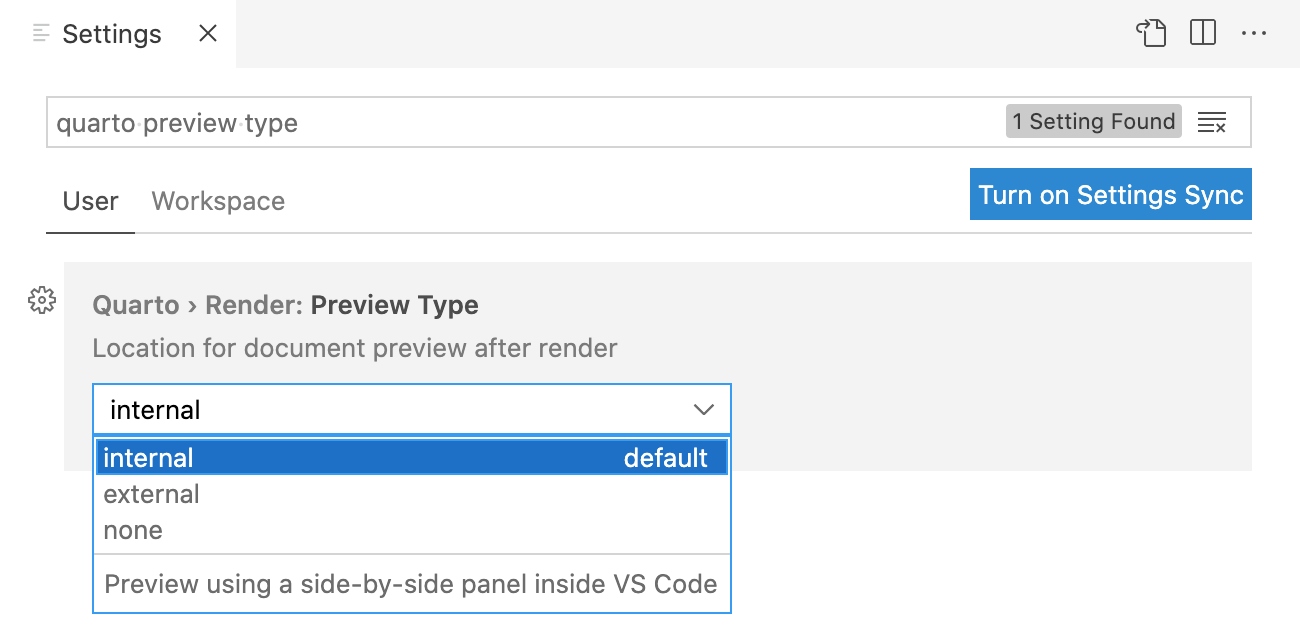## 下一步<font style="color:rgb(52, 58, 64);">您现在了解了创建和创作 Quarto 文档的基础知识。以下教程更深入地探讨了 Quarto:</font>+ [<font style="color:rgb(52, 58, 64);">教程:计算</font>](https://quarto.org/docs/get-started/computations/)<font style="color:rgb(52, 58, 64);"> </font><font style="color:rgb(52, 58, 64);">— 了解如何定制可执行代码块的行为和输出。</font>+ [<font style="color:rgb(52, 58, 64);">教程:创作</font>](https://quarto.org/docs/get-started/authoring/)<font style="color:rgb(52, 58, 64);"> </font><font style="color:rgb(52, 58, 64);">— 详细了解输出格式和技术写作功能,如引文、交叉引用和高级布局。</font><font style="color:rgb(52, 58, 64);">此外,你可能希望了解 VS Code 中可用的 Quarto 文档的其他编辑模式:</font>+ <font style="color:rgb(52, 58, 64);">用于所见即所得文档编辑</font>[<font style="color:rgb(52, 58, 64);">的可视化编辑</font>](https://quarto.org/docs/visual-editor/vscode/)<font style="color:rgb(52, 58, 64);">器。</font>`<font style="background-color:rgb(248, 249, 250);">.qmd</font>`+ <font style="color:rgb(52, 58, 64);">用于编辑笔记本</font>[<font style="color:rgb(52, 58, 64);">的笔记本编辑器</font>](https://quarto.org/docs/tools/vscode-notebook.html)<font style="color:rgb(52, 58, 64);">。</font>`<font style="background-color:rgb(248, 249, 250);">.ipynb</font>`# j——教程:Hello, Quarto+ [<font style="color:rgb(52, 58, 64);">VS 代码</font>](https://quarto.org/docs/get-started/hello/vscode.html)+ [<font style="color:rgb(52, 58, 64);">Jupyter</font>](https://quarto.org/docs/get-started/hello/jupyter.html)+ [<font style="color:rgb(52, 58, 64);">RStudio</font>](https://quarto.org/docs/get-started/hello/rstudio.html)+ [<font style="color:rgb(52, 58, 64);">Neovim的</font>](https://quarto.org/docs/get-started/hello/neovim.html)+ [<font style="color:rgb(52, 58, 64);">编辑 器</font>](https://quarto.org/docs/get-started/hello/text-editor.html)## 概述<font style="color:rgb(52, 58, 64);">在本教程中,我们将向您展示如何将 Jupyter Lab 与 Quarto 配合使用。你将在 Jupyter Lab 中编辑代码和 Markdown,就像使用任何笔记本一样,并在工作时在 Web 浏览器中预览呈现的文档。</font><font style="color:rgb(52, 58, 64);">以下是其外观的概述。</font><font style="color:rgb(52, 58, 64);">左边的笔记本</font>_<font style="color:rgb(52, 58, 64);">将呈现</font>_<font style="color:rgb(52, 58, 64);">为您在右边看到的 HTML 版本。这是 Quarto 发布的基本模型 - 获取源文档(在本例中为笔记本)并将其呈现为各种</font>[<font style="color:rgb(52, 58, 64);">输出格式</font>](https://quarto.org/docs/output-formats/all-formats.html)<font style="color:rgb(52, 58, 64);">,包括 HTML、PDF、MS Word 等。</font>**<font style="color:rgb(52, 58, 64);background-color:rgb(233, 242, 252);">注意</font>**<font style="color:rgb(52, 58, 64);">请注意,虽然本教程使用 Python,但使用 Julia(通过</font><font style="color:rgb(52, 58, 64);"> </font>[<font style="color:rgb(52, 58, 64);">IJulia</font>](https://julialang.github.io/IJulia.jl/stable/)<font style="color:rgb(52, 58, 64);"> </font><font style="color:rgb(52, 58, 64);">内核)也得到了很好的支持。有关更多详细信息,请参阅</font>[<font style="color:rgb(52, 58, 64);">有关使用 Julia</font>](https://quarto.org/docs/computations/julia.html)<font style="color:rgb(52, 58, 64);"> </font><font style="color:rgb(52, 58, 64);">的文章。</font>## 渲染<font style="color:rgb(52, 58, 64);">首先,我们将在 Jupyter Lab 中打开一个笔记本 () 并将其呈现为几种格式。如果要在自己的环境中逐步操作,请下载下面的笔记本。</font>`<font style="background-color:rgb(248, 249, 250);">hello.ipynb</font>`<font style="color:rgb(52, 58, 64);"></font>[<font style="color:rgb(52, 58, 64);">下载你好.ipynb</font>](https://quarto.org/docs/get-started/hello/_hello.ipynb)<font style="color:rgb(52, 58, 64);">然后,创建一个要在其中使用的新目录,将笔记本复制到此目录中,并在终端中切换到此目录。</font><font style="color:rgb(52, 58, 64);">接下来,执行以下命令以安装 JupyterLab 以及教程中使用的包 ( 和 打开教程笔记本:</font>`<font style="background-color:rgb(248, 249, 250);">matplotlib</font>``<font style="background-color:rgb(248, 249, 250);">plotly),</font>`| 平台 | 命令 || --- | --- || Mac/Linux操作系统 | Terminal<br/>```plain python3 -m pip install jupyter jupyterlab python3 -m pip install matplotlib plotly python3 -m jupyter lab hello.ipynb ``` || 窗户 | Terminal<br/>```plain py -m pip install jupyter jupyterlab py -m pip install matplotlib plotly py -m jupyter lab hello.ipynb ``` |<font style="color:rgb(52, 58, 64);">这是我们在 Jupyter 实验室的笔记本。</font>```plain---title: "Quarto Basics"format:html:code-fold: truejupyter: python3---For a demonstration of a line plot on a polar axis, see @fig-polar.```{python}#| label: fig-polar#| fig-cap: "A line plot on a polar axis"import numpy as npimport matplotlib.pyplot as pltr = np.arange(0, 2, 0.01)theta = 2 * np.pi * rfig, ax = plt.subplots(subplot_kw = {'projection': 'polar'})ax.plot(theta, r)ax.set_rticks([0.5, 1, 1.5, 2])ax.grid(True)plt.show()
请注意,目标文件(在本例中)应始终是第一个命令行参数。
<font style="color:rgb(52, 58, 64);">接下来,在 Jupyter Lab 中创建一个新终端以用于 Quarto 命令。</font>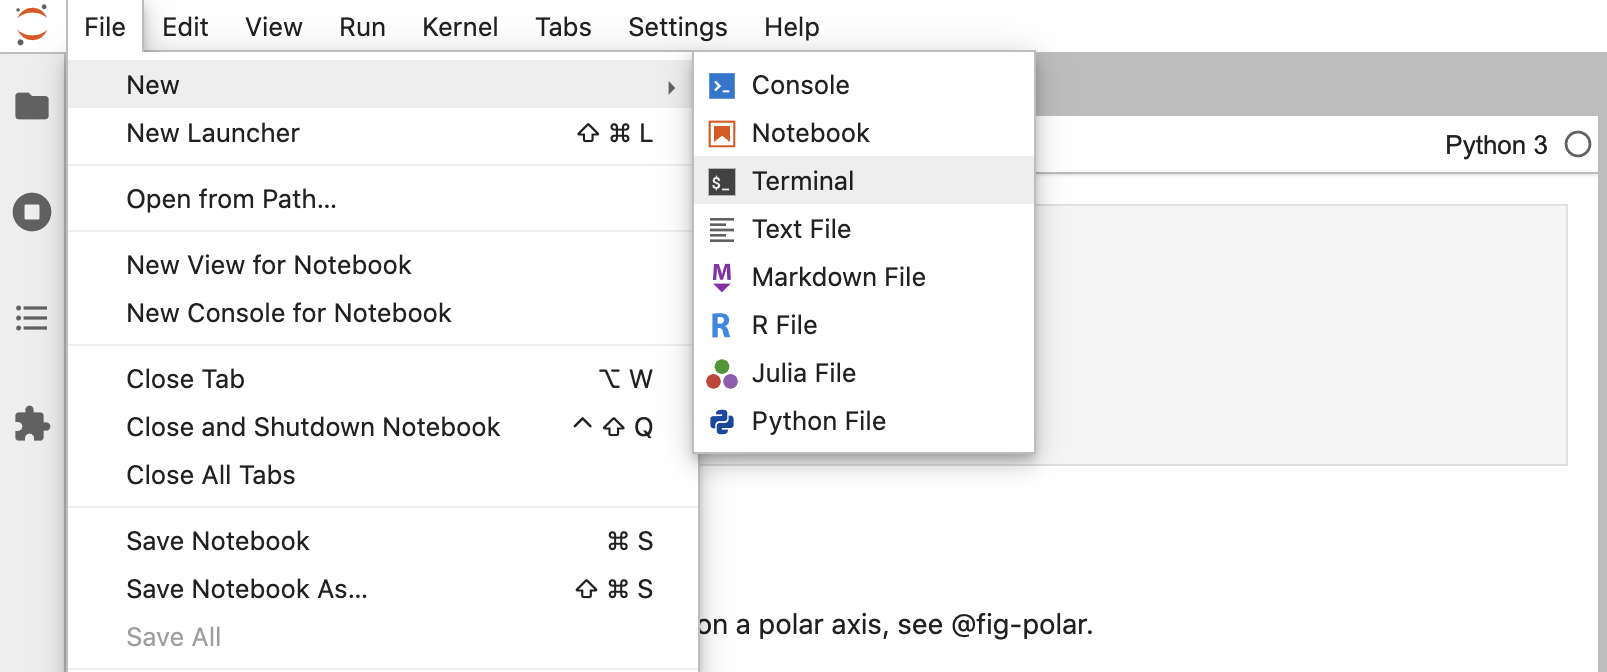<font style="color:rgb(52, 58, 64);">最后,将笔记本呈现为几种格式。</font><font style="color:rgb(52, 58, 64);">Terminal</font>```plainquarto render hello.ipynb --to htmlquarto render hello.ipynb --to docx
<font style="background-color:rgb(248, 249, 250);">hello.ipynb</font>
使用 Quarto 渲染 Jupyter 笔记本时,笔记本的内容(代码、Markdown 和输出)将转换为纯 Markdown,然后由 Pandoc 进行处理,从而创建完成的格式。
创作
该命令用于创建要分发的文档的最终版本。但是,在创作过程中,您将使用该命令。现在从终端试用 .<font style="background-color:rgb(248, 249, 250);">quarto render</font>``<font style="background-color:rgb(248, 249, 250);">quarto preview</font>``<font style="background-color:rgb(248, 249, 250);">hello.ipynb</font>
Terminal
quarto preview hello.ipynb
这将呈现您的文档,然后在 Web 浏览器中显示它。
- 更改定义如下的代码行:
<font style="background-color:rgb(248, 249, 250);">theta</font>
- 重新运行代码单元以生成绘图的新版本。
- 保存笔记本(预览将自动更新)。
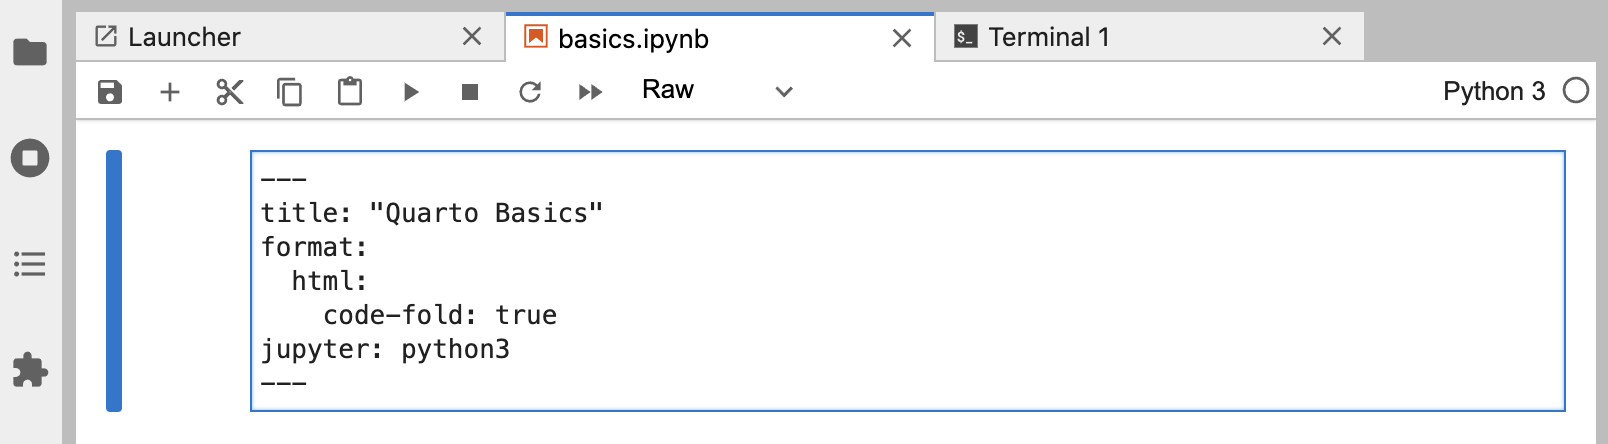
YAML 选项
您可能已经熟悉 Markdown 和代码单元格,但有一种新型单元格(“Raw”)用于文档级 YAML 选项。
---title: "Quarto Basics"format:html:code-fold: truejupyter: python3---
<font style="background-color:rgb(248, 249, 250);">code-fold</font>``<font style="background-color:rgb(248, 249, 250);">false</font>
plain
format:
  html:
    code-fold: false
然后保存笔记本。您会注意到,代码现在显示在绘图上方,而以前它使用可用于显示它的代码按钮隐藏。
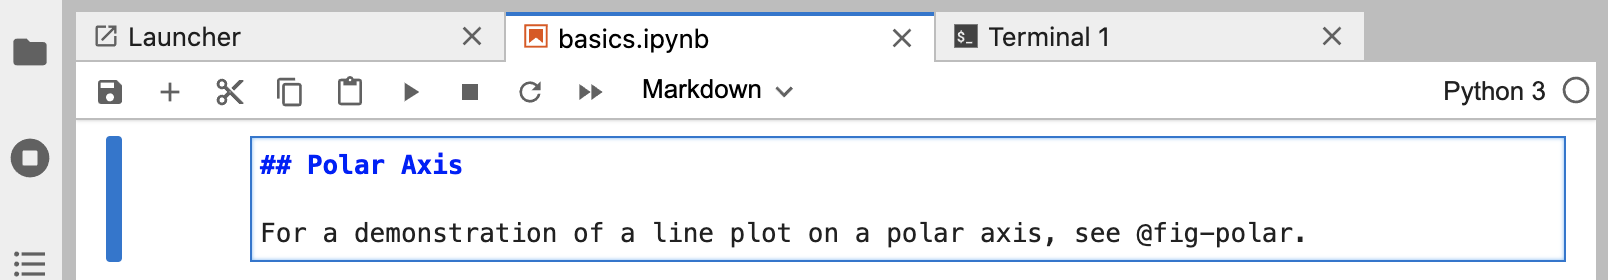
Markdown 单元格
Markdown 单元格包含原始 Markdown,将在渲染期间传递到 Quarto。您可以在这些单元格中使用任何有效的 Quarto Markdown 语法。在这里,我们指定一个标题和对在下面代码单元中创建的图形的交叉引用。
## Polar AxisFor a demonstration of a line plot on a polar axis, see @fig-polar.
代码单元
您可能已经熟悉代码单元,如下所示。
```{python}#| label: fig-polar#| fig-cap: "A line plot on a polar axis"import numpy as npimport matplotlib.pyplot as pltr = np.arange(0, 2, 0.01)theta = 2 * np.pi * rfig, ax = plt.subplots(subplot_kw = {'projection': 'polar'})ax.plot(theta, r)ax.set_rticks([0.5, 1, 1.5, 2])ax.grid(True)plt.show()
```
<font style="background-color:rgb(248, 249, 250);">label</font>``<font style="background-color:rgb(248, 249, 250);">fig-cap</font>``<font style="background-color:rgb(248, 249, 250);">#|</font>
在此示例中,单元格选项用于使图形可交叉引用。尝试更改和/或代码,运行单元格,然后保存笔记本以查看更新的预览。<font style="background-color:rgb(248, 249, 250);">fig-cap</font>
您可以应用多种单元格选项来定制输出。我们将在下一个教程中深入探讨这些选项。
注意
对于图形来说,一个特别有用的单元格选项是 ,它使您能够为有视力障碍的用户向图像添加替代文本。请参阅 Amy Cesal 关于为数据可视化编写替代文本的文章以了解更多信息。<font style="background-color:rgb(248, 249, 250);">fig-alt</font>
## 下一步
您现在了解了创建和创作 Quarto 文档的基础知识。以下教程更深入地探讨了 Quarto:
此外,您可能希望安装 Quarto JupyterLab 扩展,它提供了用于在 JupyterLab 中使用 Quarto 的其他工具。

若有收获,就点个赞吧
0 人点赞
