网页开发中我们经常要处理用户交互,我们会用 addEventListener 添加事件监听器来监听各种用户操作,比如 click、mousedown、mousemove、input 等,这些都是由用户直接触发的事件。
那么对于一些不是由用户直接触发的事件呢?比如元素从不可见到可见、元素大小的改变、元素的属性和子节点的修改等,这类事件如何监听呢?
浏览器提供了 5 种 Observer 来监听这些变动:’
- IntersectionObserver
- MutationObserver
- PerformanceObserver
- ResizeObserver
- ReportingObserver
IntersectionObserver
一个元素从不可见到可见,从可见到不可见,这种变化如何监听呢?
答:用 IntersectionObserver。
IntersectionObserver 可以监听一个元素和可视区域相交部分的比例,然后在可视比例达到某个阈值的时候触发回调。
MutationObserver
监听一个普通 JS 对象的变化,我们会用 Object.defineProperty 或者 Proxy。
而监听元素的属性和子节点的变化,我们可以用 MutationObserver。
MutationObserver 可以监听对元素的属性的修改、对它的子节点的增删改。
应用场景
- 文章水印被人通过 devtools 去掉了,那么就可以通过 MutationObserver 监听这个变化,然后重新加上,让水印去不掉。
// 创建观察者var observer = new MutationObserver(callback);// callback 有两个参数// 1. 描述所有被触发改动的 MutationRecord 对象数组// 2. 调用该函数的 MutationObserver 对象,即我们上面 new MutationObserver() 的返回对象function callback(mutationList, observerObject) {console.log(mutationList)console.log(observer === observerObject) // true}// 观察某个 DOM 节点的变化// 只能观察一个 DOM 节点。新的会覆盖旧的observer.observe(DOMnode, {childList: true, // 观察目标是否有添加或者删除子节点attributes: true, // 观察属性变动subtree: true // 观察后代节点的变化,默认为 false})// 取消观察某个 DOM 节点的变化observer.disconnect()// 从 MutationObserver 的通知队列中删除所有待处理的通知,并将它们返回到 MutationRecord 对象的新 Array 中。observer.takeRecords()
PerformanceObserver
浏览器提供了 performance 的 api 用于记录一些时间点、某个时间段、资源加载的耗时等。
我们希望记录了 performance 那就马上上报,可是怎么知道啥时候会记录 performance 数据呢?
答:用 PeformanceObserver。
PerformanceObserver 用于监听记录 performance 数据的行为,一旦记录了就会触发回调,这样我们就可以在回调里把这些数据上报。
performace
window.performance 可以获取到当前页面中与性能相关的信息。它是高分辨率时间 API 的一部分。
它融合了 Peformance Timeline API、Navigation Timing API、User Timing API、Resource Timing API。
performance 在 Web Worker 环境下也可用,只不过有些属性方法用不了。 注意:performance 的创建和衡量都是同一环境下的。即,如果你在主线程(或者其他 worker)中创建了一个 performance,那么它在另外的 worker 线程中是不可用的。
performance 的属性和方法
- 属性
- navigation
- 记录了页面是加载还是刷新、发生了多少次重定向等等
- Web Worker 中不可用
- timeOrigin
- 返回性能测量开始时的时间的高精度时间戳
- timing
- 包含延迟相关的性能信息
- Web Worker 中不可用
- memory
- Chrome 添加的一个非标准扩展,这个属性提供了一个可以获取到基本内存使用情况的对象。
- 不应该使用这个非标准的 API。
- navigation
- 方法
- mark()
- 根据给出 name 值,在浏览器的性能输入缓冲区中创建一个相关的 timestamp
- clearMarks()
- 将给定的 mark 从浏览器的性能输入缓冲区中移除。
- measure()
- 在浏览器的指定 start mark 和 end mark 间的性能输入缓冲区中创建一个指定的 timestamp
- clearMeasures()
- 将给定的 measure 从浏览器的性能输入缓冲区中移除。
- setResourceTimingBufferSize()
- 将浏览器的资源 timing 缓冲区的大小设置为 “resource” entryType 的 performance entry 对象的指定数量
- clearResourceTimings()
- 从浏览器的性能数据缓冲区中移除所有 entryType 是 “resource” 的 performance entries。
- getEntries()
- 基于给定的 filterOption 返回一个 PerformanceEntry 对象的列表。
- getEntriesByName()
- 基于给定的 name 和 entry type 返回一个 PerformanceEntry 对象的列表。
- getEntriesByType()
- 基于给定的 entry type 返回一个 PerformanceEntry 对象的列表
- now()
- 返回一个表示从性能测量时刻开始经过的毫秒数 DOMHighResTimeStamp
- toJSON()
- mark()
 ```javascript
const {
timing // 包含延迟相关的性能信息
} = performance
```javascript
const {
timing // 包含延迟相关的性能信息
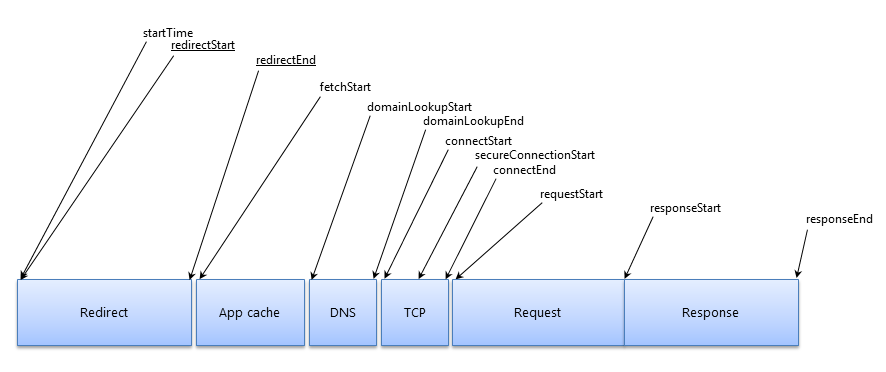
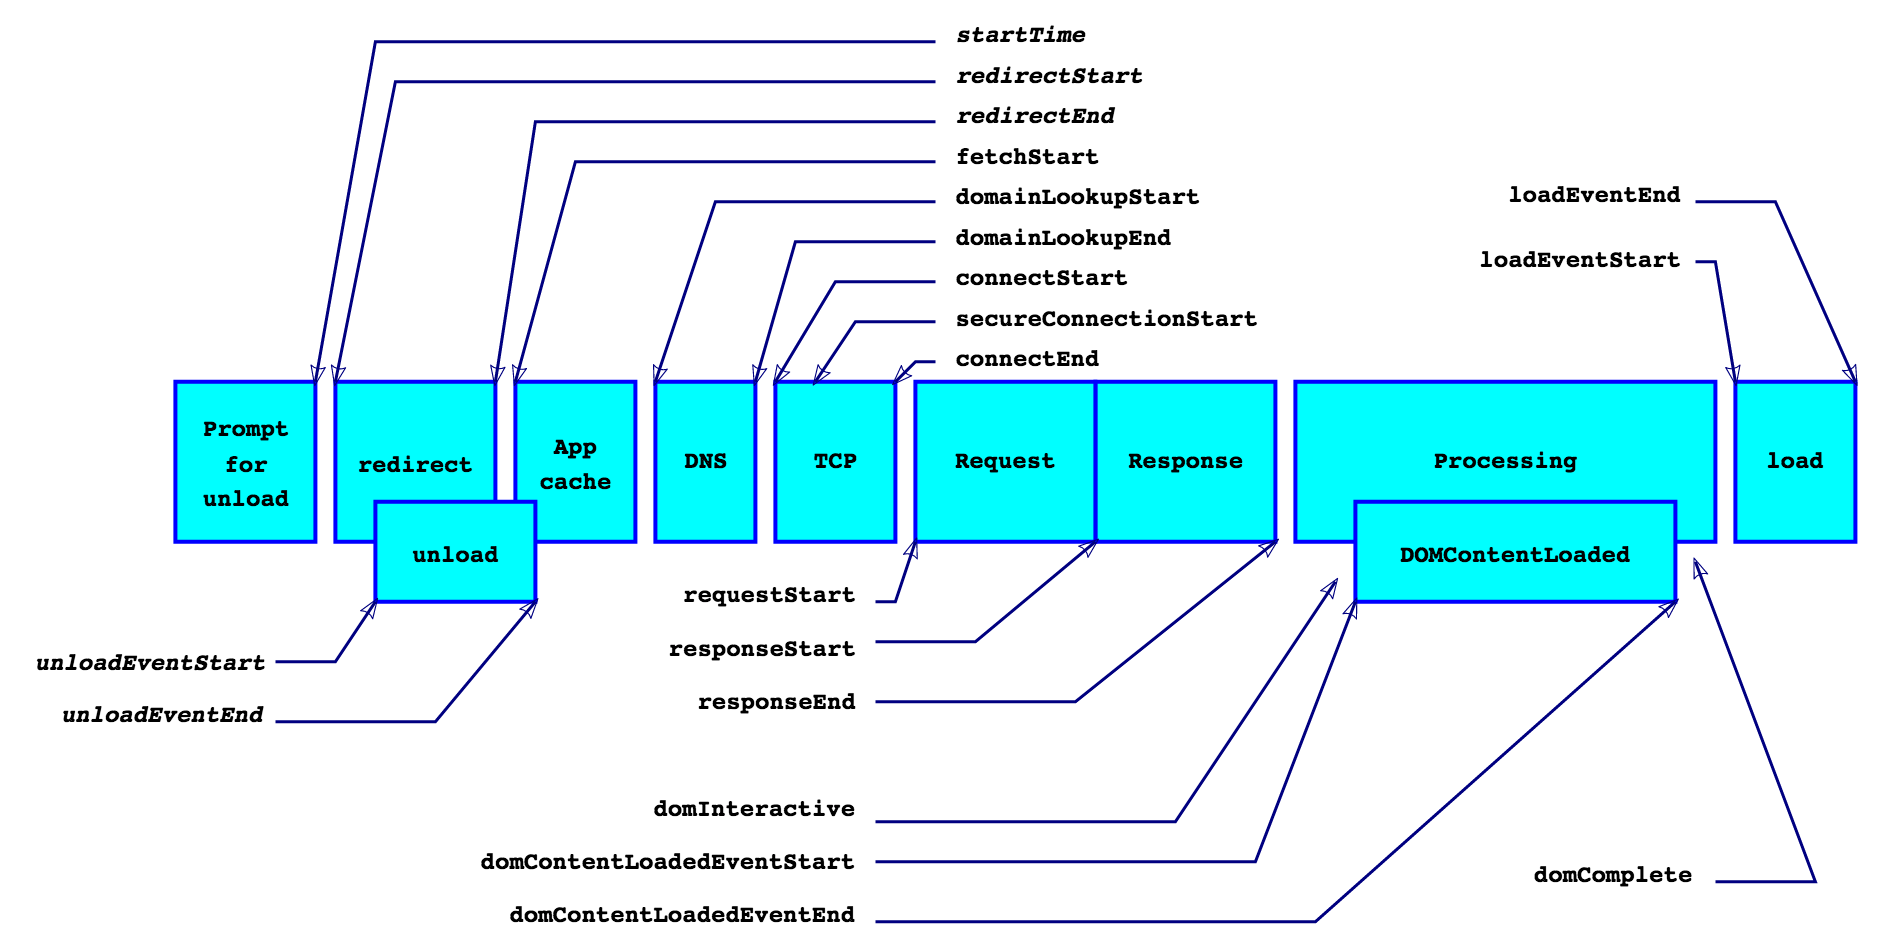
} = performance// dns 解析时间 const dnsTime = timing.domainLookupEnd - timing.domainLookupStart // tcp 建立连接的时间 const tcpTime = timing.connectEnd - timing.connectStart // 卸载页面的时间 const unloadTime = timing.unloadEventEnd - timing.unloadEventStart
// 【重要】解析 DOM 树结构的时间 // 【反省】DOM 树嵌套是不是太多了 const parserDOMTime = timing.domComplete - timing.domInteractive
// 【重要】重定向的时间 // 【反省】拒绝重定向!比如,http://example.com/ 不该写成 http:example.com const redirectTime = timing.redirectEnd - timing.redirectStart
// 【重要】客户端发起 HTTP 请求到客户端拿到资源的时间 // 【反省】可以理解为用户拿到你的资源过程中,占用的时间。加异地机房了么,加 CDN 处理了么?加带宽了么?加 CPU 运算速度了么? // 维基百科:https://en.wikipedia.org/wiki/Time_To_First_Byte const timeToFirstByte = timing.responseStart - timing.navigationStart
// 【重要】执行 onload 回调函数的时间 // 【反省】是否执行太多不必要的操作了?考虑过延迟加载、按需加载的策略么? const onloadTime = timing.loadEventEnd - timing.loadEventStart
<a name="UB1H7"></a>### getEntries 方法基于给定的 filterOptions 返回一个 [PerformanceEntry](https://developer.mozilla.org/zh-CN/docs/Web/API/PerformanceEntry) 对象的数组,顺序按照 startTime 从小到大排序。```javascript/*** filterOptions 不传时,取全部数据** filterOptions 的配置* 1. name: 代表 performanceEntries 的 name* 资源的路径 (navigation/resource) | 自定义 performance.mark | 自定义 performance.measure* 2. entryType: 代表 performanceEntries 的类型 —— 可以调用 PerformanceObserver.supportedEntryTypes 查看支持的类型。* element | event | first-input | largest-contentful-paint | longtask | mark | measure | paint | navigation | resource* 3. initialtorType: 代表 performanceEntries 资源的类型* navigation | link | img | script | css | fetch | iframe | beacon | xmlhttprequest | ...*/const performanceEntries = window.performance.getEntries(<filterOptions>)// 使用示例// 拿出所有 css 资源的性能信息const filterOptions = { entryType: 'resource', initialtorType: 'css' }const performanceEntries = window.performance.getEntries(filterOptions)
mark 方法
应用这个方法,浏览器会在性能缓冲区中添加一个 PerformanceEntry。
下次获取
performance.getEntries就能看到这个 PerformanceEntry
const name = 'konosue'// 做标记performance.mark(name)// 在性能缓冲区添加的 PerformanceEntryPerformanceEntry = {entryType: 'mark',name: 'konsoue',startTime: <标记时的高精度时间戳>,duration: 0 // 持续时间,mark 没有持续时间}
PerformanceObserver
PerformanceObserver 是一个构造函数。
- 构造函数的属性
PerformanceObserver.supportedEntryTypes
它构造出来的实例,是一个对象(performanceObserver),可以用于监听 performance 的变化
- 实例的方法
disconnect():取消监听observe(options):注册监听 performance 哪些类型的变化 的 事件回调takeRecords()```javascript // 定义回调函数 var callback = function(performanceObserverEntries, observer) { // performanceObserverEntries }
// 创建观察 performance 的实例 var performanceObserver = new PerformanceObserver(callback); // 设置观察 performance 的哪些类型 entryType // 比如观察 resource performanceObserver.observer({ entryType: [‘resource’] }) ```
参考资料

若有收获,就点个赞吧
0 人点赞
