飞线图实现原理
- 绘制背景的地图,geogeo画地图
- 绘制散点图,effectScatter在地图上画散点图
- 绘制飞线图, series.type: ‘lines’,lines绘制飞线
- 需要关闭 animation: false,否则会有上一个飞线的残影痕迹
地图绘制要点
- geoJson
- geoCoordMap
- [开始城市数据,结束城市数据]
- convertLinesData 城市 geoCoord转换为飞线图的坐标系数据[
](https://echarts.apache.org/examples/zh/editor.html?c=geo-lines)
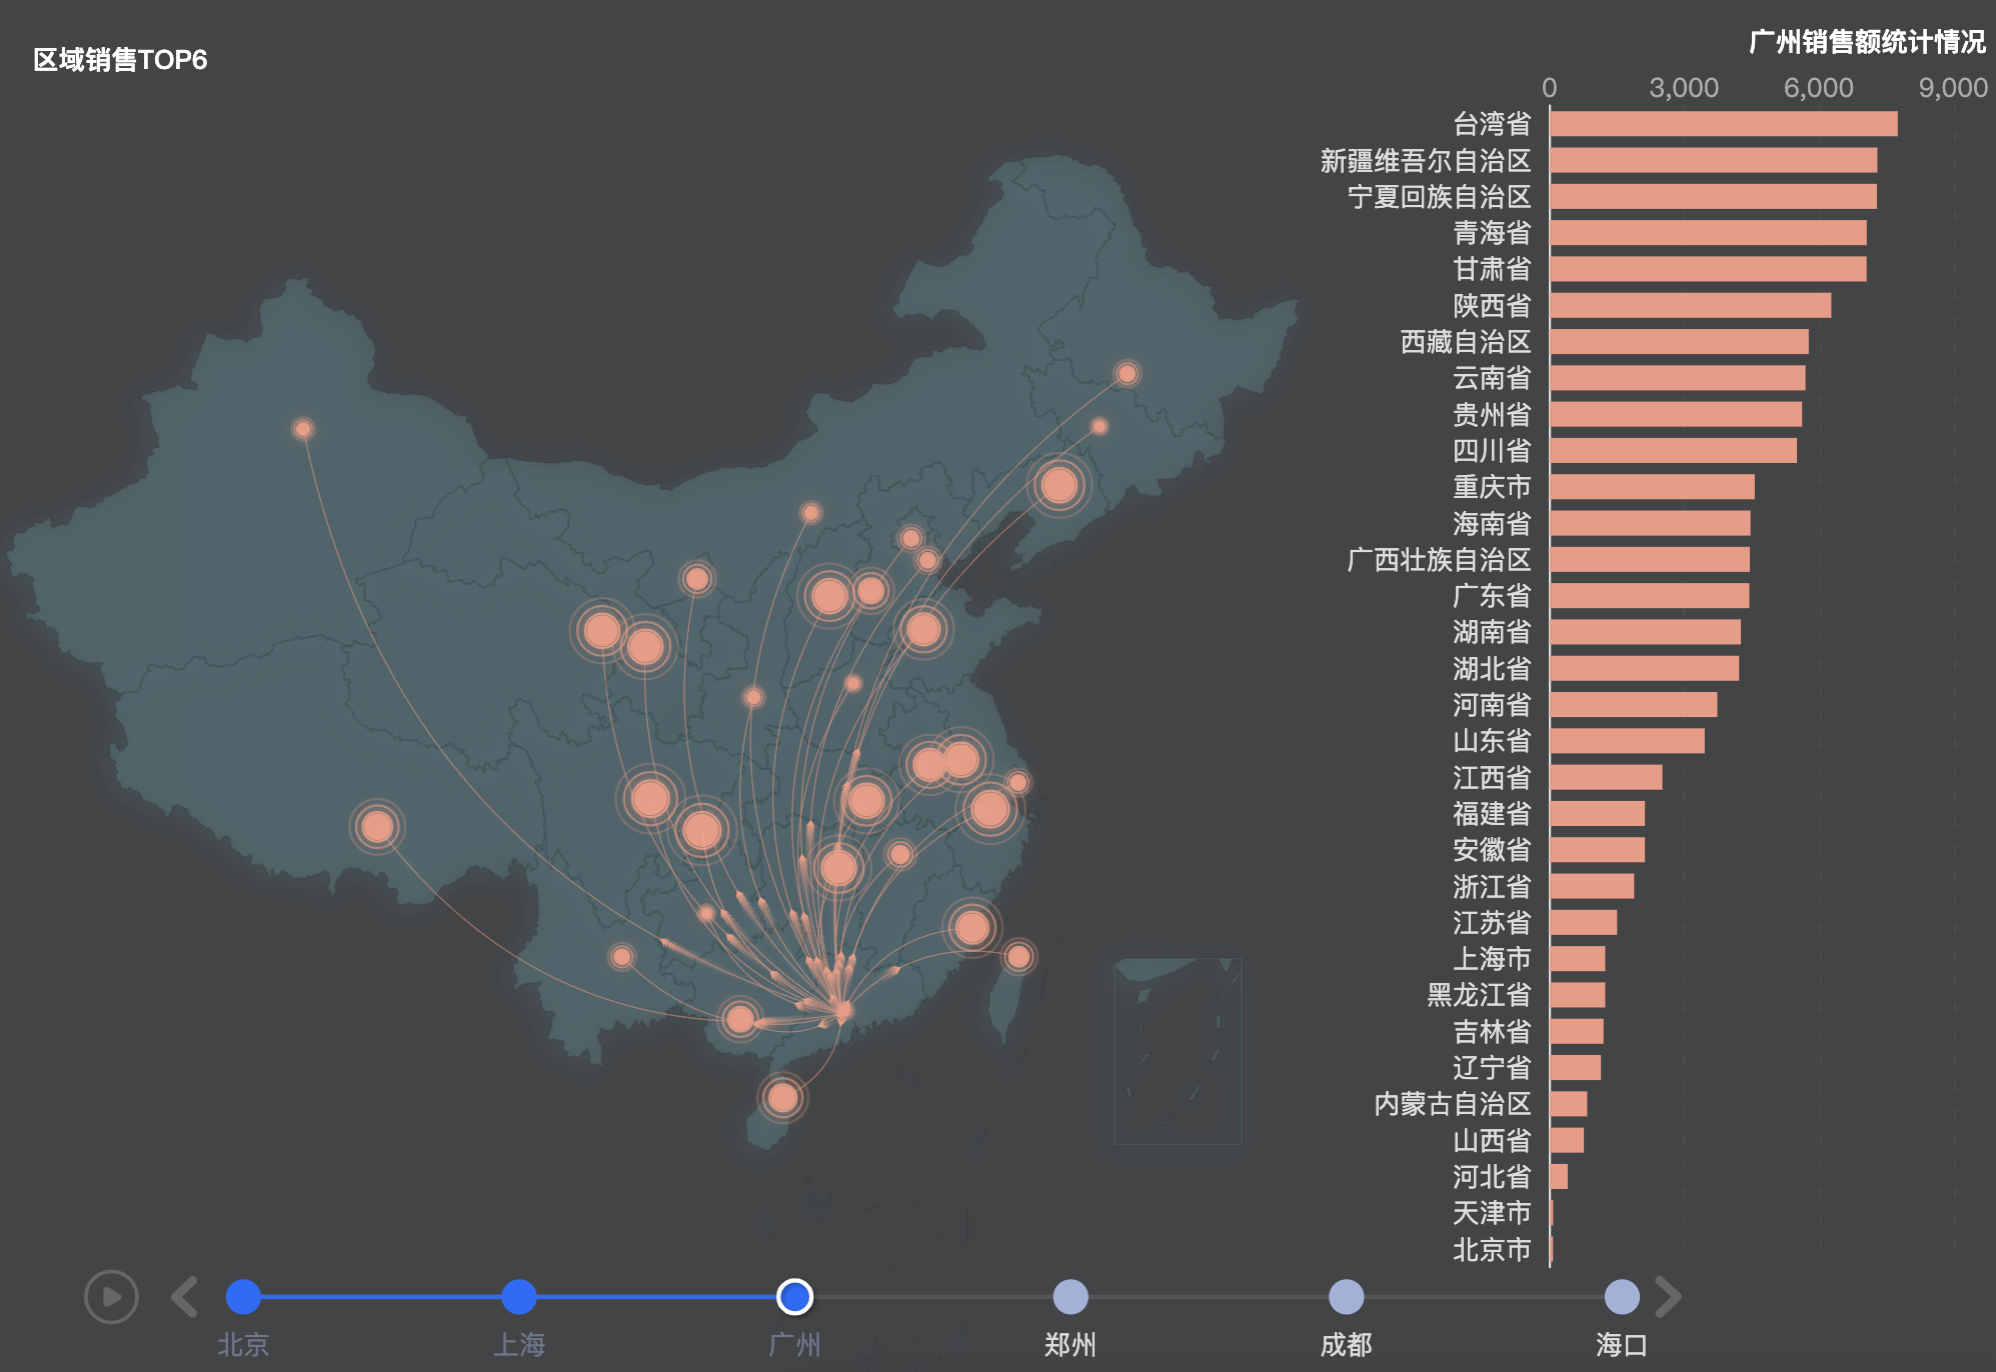
销售TOP排行
切换动画残影
解决: animation: false 关闭动画
timeline切换飞线图,清除上一个飞线的痕迹,即动画残影。
文档 https://echarts.apache.org/zh/option.html#series-lines.effect
options
import * as echarts from 'echarts';import {chinaJson} from '@/components/ECharts/Map';import {getData, colors, provinces, convertData, convertLinesData} from './_data';import {geo, timeline, baseOption} from './config';const cities = ['北京', '上海', '广州', '郑州', '成都', '海口'];const mapData = cities.map((it, i) => []);const cityGeoCoord = [[116.4551, 40.2539],[121.4648, 31.2891],[113.12244, 23.009505],[113.4668, 34.6234],[103.9526, 30.7617],[110.3893, 19.8516],];const series = {data1: getData(10, 6000),data2: getData(10, 7000),data3: getData(10, 8000),data4: getData(10, 9000),data5: getData(100, 6000),data6: getData(100, 3000),}function chinaOption() {echarts.registerMap('china', chinaJson);// 柱图数据 [[], [], [], [], [], []]provinces.filter(it => it.code).forEach((item, index) => {const key = item.name;mapData.forEach((child, i) => {const {value} = series[`data${i + 1}`].find(it => it.name === key) || {};child.push({name: key, value})child.sort((a, b) => a.value - b.value)})});// 柱图 X轴数据 [[], [], [], [], [], []]// const xdata = cities.map((it, i) => {// return mapData[i].map(it => it.name);// });// 柱状图数据const barData = cities.map((it, i) => {return mapData[i].map(it => it.value);});const config = {timeline: timeline(cities),baseOption: {...baseOption(provinces),geo,},options: [],}// options[] 里面的每一项会合并 baseOptioncities.forEach((item, i) => {const color = colors[3][i];const rowData = {title: [{text: '区域销售TOP6',left: 16,top: 16,textStyle: {color: '#fff',fontSize: 12,}},{id: 'statistic',text: `${item}销售额统计情况`,top: 8,right: 4,textStyle: {color: '#fff',fontSize: 12}}],series: [// 2 在绘制散点图{type: 'effectScatter',coordinateSystem: 'geo',data: convertData(mapData[i]),symbolSize: arr => arr[2],showEffectOn: 'render',hoverAnimation: true,zlevel: 1,// 涟漪配置// https://echarts.apache.org/zh/option.html#series-effectScatter.rippleEffectrippleEffect: {brushType: 'stroke'},label: {normal: {formatter: '{b}',position: 'right',show: false // 全部显示,太拥挤了,高亮显示文字},emphasis: {show: true}},// 散点图颜色和柱图保持一致itemStyle: {normal: {color,shadowBlur: 8,shadowColor: color}},},// 3 最后绘制飞线图{name: `${item}销售TOP6`,type: 'lines',data: convertLinesData(mapData[i], cityGeoCoord[i]),zlevel: 2,effect: {show: true, // 带有动画的飞线period: 4, // 箭头指向速度,值越小速度越快trailLength: 0.02, // 特效尾迹长度[0,1]值越大,尾迹越长重symbol: 'arrow', // 箭头图标symbolSize: 3 // 图标大小},lineStyle: {normal: {color,width: 0.1, // 尾迹线条宽度opacity: 0.5, // 尾迹线条透明度curveness: 0.3 // 尾迹线条曲直度,线条的弧度,不加这个是直线}},animation: false},// 1 先绘制柱状图{zlevel: 1.5,type: 'bar',data: barData[i],itemStyle: {normal: {color}},}]}config.options.push(rowData);});return config;}export default chinaOption;
convertLinesData
应用场景
- 物流的流向
// 飞线图的数据export function convertLinesData(data, fromGeoCoord) {return data.map(item => {const {name, value} = item;const {geoCoord} = provinces.find(it => it.name === name) || {};return [// 起点位置{ coord: fromGeoCoord, value, },// 终点位置{ coord: geoCoord }]});}

若有收获,就点个赞吧
0 人点赞
