echarts封装的思考点
- echarts的事件处理
- 监听窗口变动事件,DOM尺寸发生变化时,图表能够自适应
- 延迟 echarts 渲染,resize-detector
- ResizeObserver - 元素resize监听API
- 离开销毁组件实例,防止内存泄漏
- id重复带来的 bug,用 uuid优化
import echarts from 'echarts/lib/echarts'import debounce from 'lodash/debounce'import { addListener, removeListener } from 'resize-detector'
Echarts.jsx按需引入封装
Echarts.jsx
import React, {useCallback, useEffect, useRef} from 'react';import {object, number, array, oneOf, bool} from 'prop-types';import debounce from 'lodash.debounce';// 引入核心模块 echarts必须要的接口import * as echarts from 'echarts/core';// 必须引入渲染器 CanvasRenderer & SVGRendererimport {CanvasRenderer, SVGRenderer} from 'echarts/renderers';// const dpr = window.devicePixelRatio; // 设备分辨率const RenderEngine = {canvas: CanvasRenderer,svg: SVGRenderer}Echarts.propTypes = {options: object.isRequired,height: number,renderType: oneOf(['canvas', 'svg']),components: array,style: object,loading: bool,};Echarts.defaultProps = {height: 240,renderType: 'canvas',components: [],style: {},loading: false,};function Echarts(props) {const {renderType, options, style, height, components, loading} = props;const chartRef = useRef(null); // DOM节点const chartInstance = useRef(null); // Echart实例const isEmpty = !Object.keys(options || {}).length; // options是否为空const handleResize = debounce(() => {const {current} = chartInstance;if (!current) return;current.resize({animation: {duration: 500}});}, 300);// 初始化图表配置项const renderChart = useCallback(() => {if(isEmpty) returnconst {current} = chartRef;if (!current) {return console.error('init echarts DOM error');}// 单例模式,获取 dom容器上的实例const render = echarts.getInstanceByDom(current);chartInstance.current = render ?? echarts.init(current, null, {renderer: renderType,});showLoading(chartInstance.current)chartInstance.current.setOption(options);}, [options, renderType, loading]);useEffect(init, []);// 注册必须的组件function init() {const MapRender = RenderEngine[renderType] || CanvasRenderer;// 必须在echarts.init之前使用echarts.use([MapRender, ...components]);// 监听 resize屏幕变化window.addEventListener('resize', handleResize);return () => {window.removeEventListener('resize', handleResize);};}useEffect(() => {renderChart();return () => {const {current} = chartInstance;if (!current) return;current.dispose();}}, [chartInstance, renderChart]);function showLoading(chartInstance) {if(!loading) {return chartInstance.hideLoading()}chartInstance.showLoading("default", {text: "加载中...",color: "rgb(244, 148, 148)",textColor: "rgb(112,112, 121)",maskColor: "rgba(255, 255, 255, 0.8)",zlevel: 0,showSpinner: true,});}if(!Object.keys(options).length) {return null}const attrs = {ref: chartRef,style: {height,...style,}}return (<div {...attrs}/>);}export default Echarts;
响应式
import {useCallback, useEffect, useRef} from 'react';import {object, number, string, array, oneOf, bool, oneOfType, func,} from 'prop-types';import classnames from 'classnames';import debounce from 'lodash.debounce';import { useResizeDetector } from 'react-resize-detector';// 引入核心模块 echarts必须要的接口import * as echarts from 'echarts/core';// 必须引入渲染器 CanvasRenderer & SVGRendererimport {CanvasRenderer, SVGRenderer} from 'echarts/renderers';import { UniversalTransition } from 'echarts/features';// const dpr = window.devicePixelRatio; // 设备分辨率const RenderEngine = {canvas: CanvasRenderer,svg: SVGRenderer}ECharts.propTypes = {options: object.isRequired,height: oneOfType([number, string]),renderType: oneOf(['canvas', 'svg']),components: array,style: object,loading: bool,className: string,onClick: func,};ECharts.defaultProps = {height: 240,renderType: 'canvas',components: [],style: {},loading: false,onClick: () => {},};function ECharts(props) {const {renderType, options, components, loading,className, style, height, onClick,} = props;// DOM节点const { width, ref } = useResizeDetector();const chartInstance = useRef(null); // Echart实例const handleResize = debounce(() => {const {current} = chartInstance;if (!current) return;current.resize({animation: {duration: 500}});}, 300);// 初始化图表配置项const renderChart = useCallback(() => {const isEmpty = !Object.keys(options || {}).length; // options是否为空if(isEmpty) {return null;}const {current} = ref;if (!current) {return console.error('init echarts DOM error');}// 单例模式,获取 dom容器上的实例const render = echarts.getInstanceByDom(current);chartInstance.current = render ?? echarts.init(current, null, {renderer: renderType,locale: 'ZH',});showLoading(chartInstance.current)// chartInstance.current.clear();chartInstance.current.setOption(options);chartInstance.current.off('click');chartInstance.current.on('click', onClick);}, [options, renderType, loading]);useEffect(init, []);useEffect(update, [width, height]);useEffect(() => {renderChart();return () => {const {current} = chartInstance;if (!current) return;current.dispose();}}, [chartInstance, renderChart]);// 注册必须的组件function init() {const MapRender = RenderEngine[renderType] || CanvasRenderer;// 必须在echarts.init之前使用echarts.use([MapRender,UniversalTransition,...components]);// 监听 resize屏幕变化window.addEventListener('resize', handleResize);return () => {window.removeEventListener('resize', handleResize);};}function update() {if(!width) return;handleResize();}function showLoading(chartInstance) {if(!loading) {return chartInstance.hideLoading()}chartInstance.showLoading("default", {text: "加载中...",color: "rgb(244, 148, 148)",textColor: "rgb(112,112, 121)",maskColor: "rgba(255, 255, 255, 0.8)",zlevel: 0,showSpinner: true,});}if(!Object.keys(options).length) {return null}const attrs = {className: classnames(className),ref,style: {height,...style,}}return (<div {...attrs}/>);}export default ECharts;
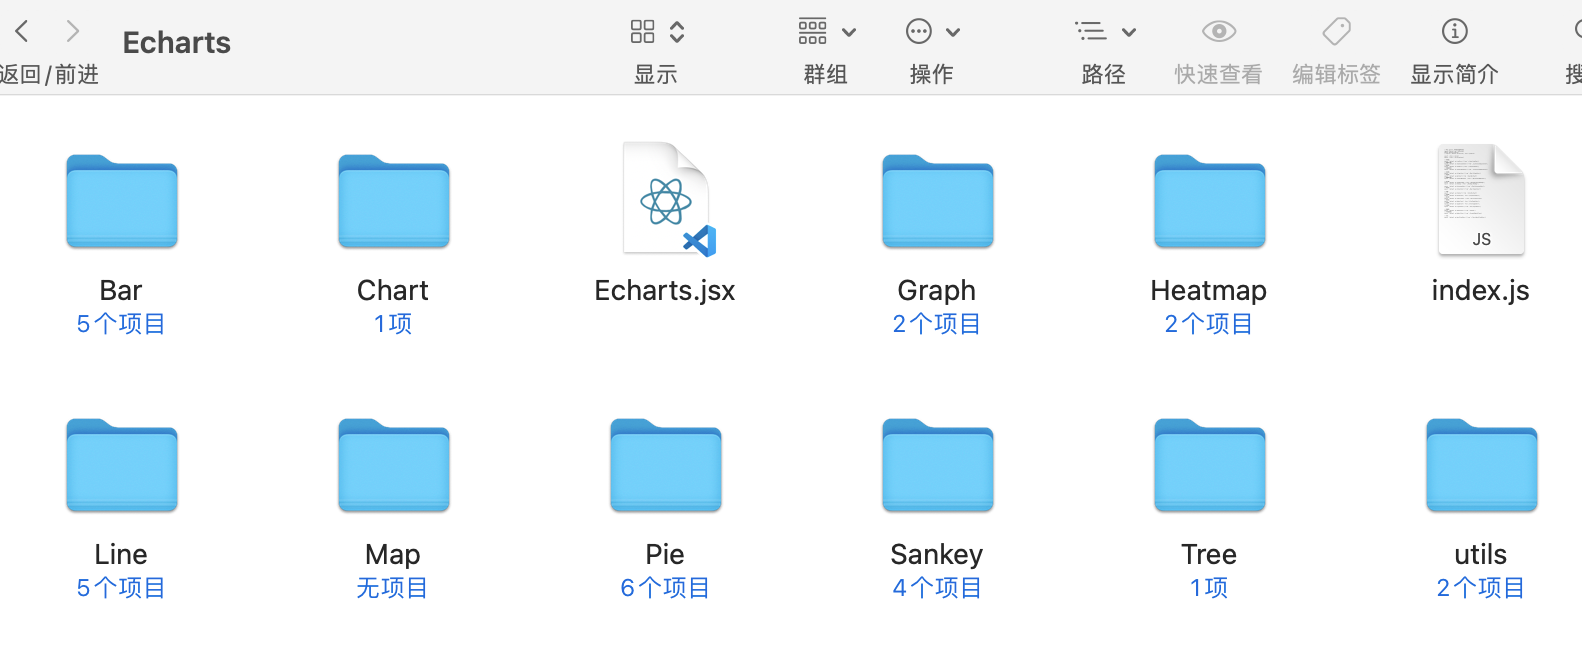
echarts目录规范


