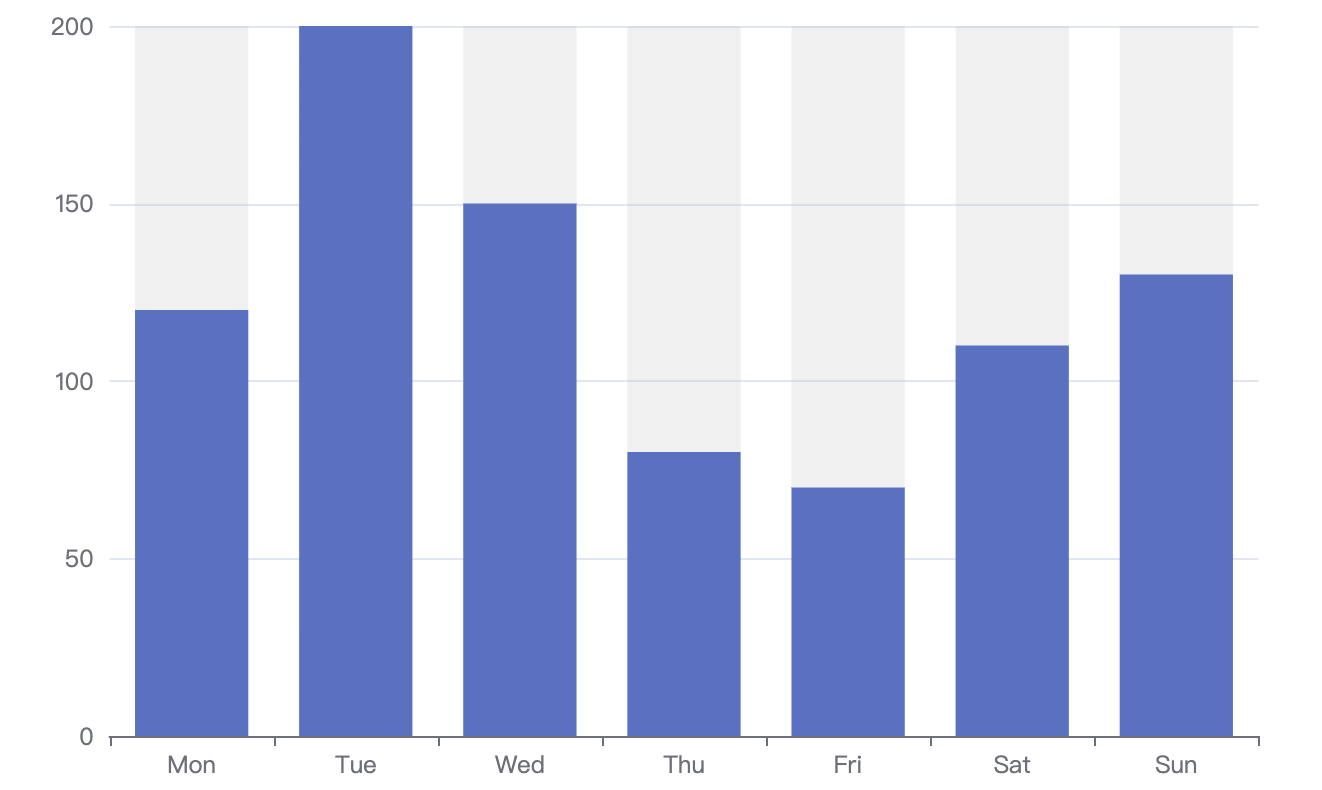
const options = {xAxis: {type: 'category',data: ['Mon', 'Tue', 'Wed', 'Thu', 'Fri', 'Sat', 'Sun']},yAxis: {type: 'value'},series: [{data: [120, 200, 150, 80, 70, 110, 130],type: 'bar',showBackground: true,backgroundStyle: { // 设置背景色color: 'rgba(180, 180, 180, 0.2)'}}]}

若有收获,就点个赞吧
0 人点赞
