echarts 自定义图表参考
type: ‘custom’ https://echarts.apache.org/zh/option.html#series-custom.type
https://blog.csdn.net/WuLex/article/details/78828301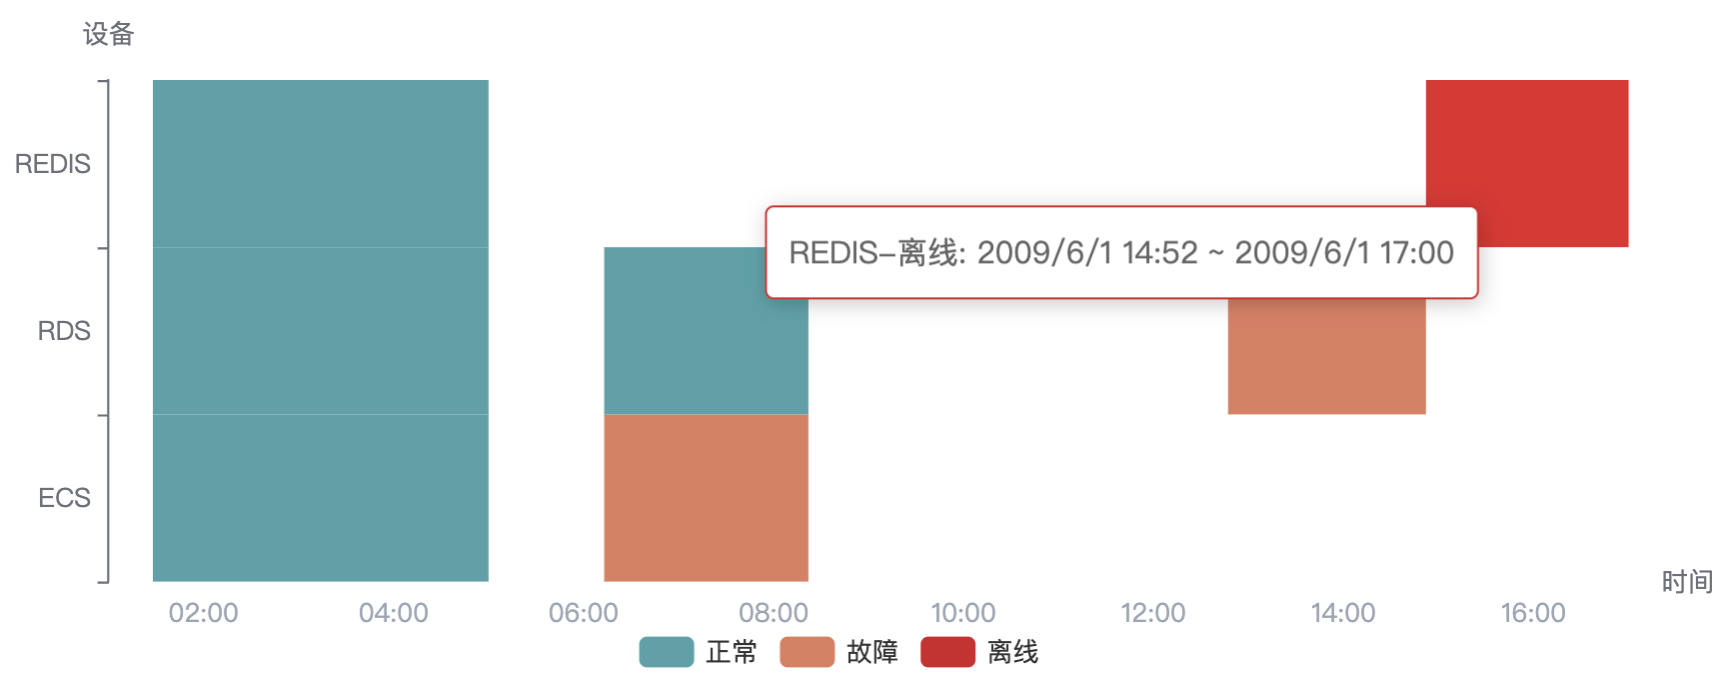
format
xAxis.axisLabel.formatter
https://echarts.apache.org/zh/option.html#xAxis.axisLabel.formatter
{xAxis: {name: '时间',type: 'time',interval: 3600 * 1000, // 以一个小时递增// x轴零刻度对应的实际值,将data里最小时间的整点时间设为min,否则min会以data里面的min为开始进行整点递增min: '2009/6/1 1:00',axisLabel: {color: '#9da5b2',formatter: '{HH}:{mm}',}}}
options
/*** Description: 用条形图的不同颜色,来表示不同时间区间段的状态* y轴用于展示各网口* x轴用于展示时间(分钟)* 以 ECS为例* 图中则表示了0~10分钟为正常,10~25分钟为繁忙,25~45分钟为故障,45~60分钟为离线*/import moment from 'moment';import * as echarts from 'echarts/core';function getzf(num) {if (parseInt(num) < 10) { num = '0' + num; }return num;}// 各状态的颜色const color = ['#61a0a8', '#d48265', '#c23531'];// 状态const state = ['正常', '故障', '离线'];// 设备const deviceData = ['ECS', 'RDS', 'REDIS'];export function getOption({ length, theme}) {return {color,grid: {top: length === 1 ? 24 : 40,left: 24,right: 40,bottom: 32,containLabel: true,},xAxis: {name: '时间',type: 'time',interval: 3600 * 1000, // 以一个小时递增// x轴零刻度对应的实际值,将data里最小时间的整点时间设为min,否则min会以data里面的min为开始进行整点递增min:'2009/6/1 1:00',axisLabel: {color: '#9da5b2',formatter: (value) => { // value 时间戳console.log('value', value)return moment(value).format('HH:mm');},}},yAxis: {name: '设备',data: deviceData,},series: [// 用空bar来显示四个图例{ name: state[0], type: 'bar', data: [] },{ name: state[1], type: 'bar', data: [] },{ name: state[2], type: 'bar', data: [] },{type: 'custom',// 自定义的图形元素渲染逻辑,通过 renderItem 函数实现的renderItem: (params, api) => {// api.value(0) 取出当前 dataItem 中第一个维度的数值const categoryIndex = api.value(0)// 用 api.coord(...) 将数值在当前坐标系中转换成为屏幕上的点的像素值const start = api.coord([api.value(1), categoryIndex])const end = api.coord([api.value(2), categoryIndex])const height = api.size([0, 1])[1];return {type: 'rect', // 图形元素是矩形。还可以是 'circle' 'sector' 'polygon'// 矩形的位置和大小shape: echarts.graphic.clipRectByRect({x: start[0],y: start[1] - height / 2,width: end[0] - start[0],height: height,},{x: params.coordSys.x,y: params.coordSys.y,width: params.coordSys.width,height: params.coordSys.height,}),style: api.style(),}},encode: {x: [1, 2], // data 中『维度1』和『维度2』对应到 X 轴y: 0, // data 中『维度0』对应到 Y 轴},data: [{itemStyle: { normal: { color: color[0] } },name: '正常',// 0 代表y轴的索引,1,2代表x轴数据开始和结束value: [0, '2009/6/1 1:28', '2009/6/1 5:00'],},{itemStyle: { normal: { color: color[1] } },name: '故障',value: [0, '2009/6/1 6:13', '2009/6/1 8:22']},// 第二个数据; 1 代表第二个数据{itemStyle: { normal: { color: color[0] } },name: '正常',value: [1, '2009/6/1 1:28', '2009/6/1 5:00'],},{itemStyle: { normal: { color: color[0] } },name: '正常',value: [1, '2009/6/1 6:13', '2009/6/1 8:22']},{itemStyle: { normal: { color: color[1] } },name: '故障',value: [1, '2009/6/1 12:47', '2009/6/1 14:52']},// 第三个数据; 2 代表第三个数据{itemStyle: { normal: { color: color[0] } },name: '正常',value: [2, '2009/6/1 1:28', '2009/6/1 5:00'],},{itemStyle: { normal: { color: color[2] } },name: '离线',value: [2, '2009/6/1 14:52', '2009/6/1 17:00']},],},],tooltip: {formatter: (params) => {const { name, value} = params;const [a,x, y] = value;return `${deviceData[a]}-${name}: ${x} ~ ${y}`;},},legend: {data: state,bottom: 8,selectedMode: false, // 图例设为不可点击textStyle: {color: theme === 'dark' ? '#fff' : '#333',},},};}
在线离线柱图
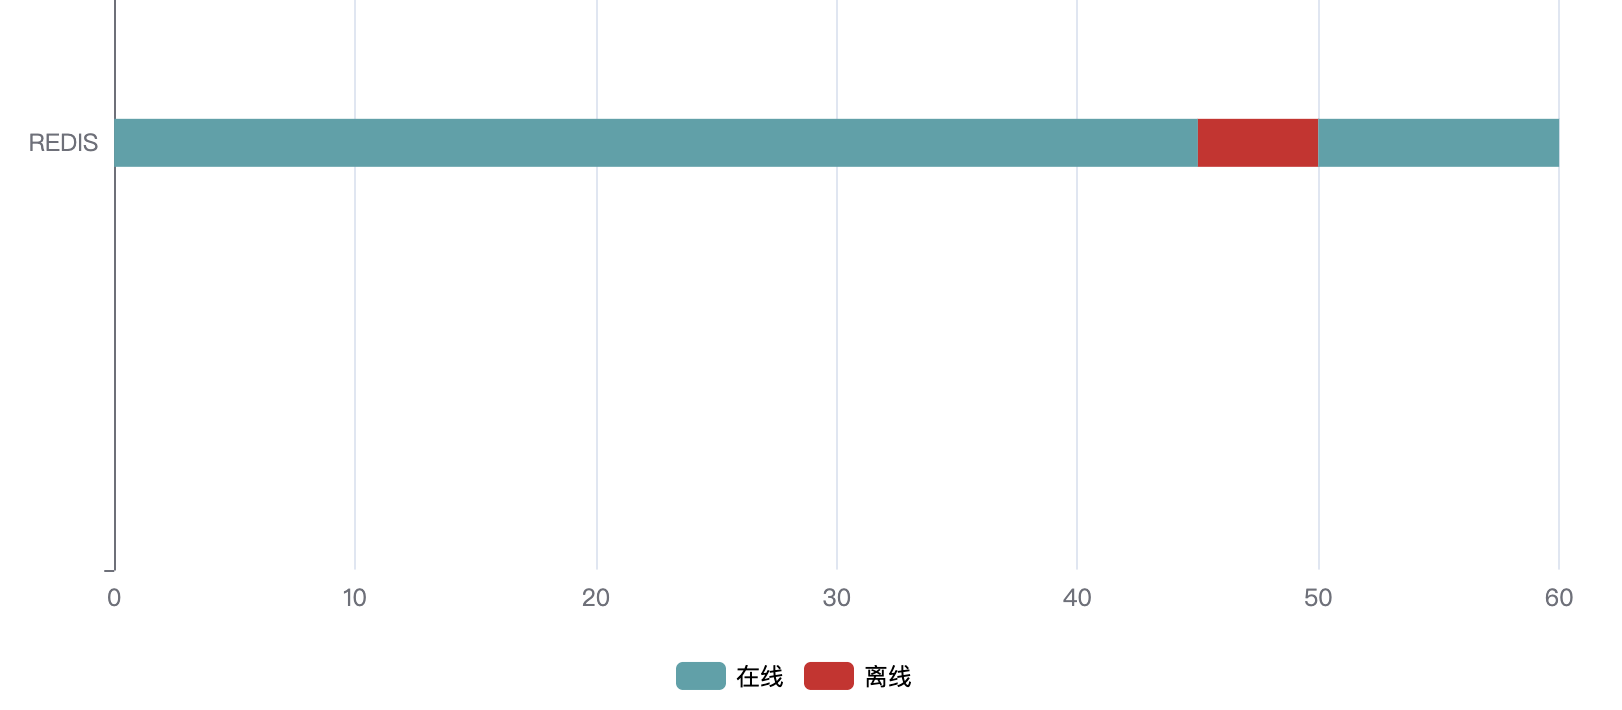
import * as echarts from 'echarts/core';const state = ['在线', '离线'];const color = ['#41c669', '#ff6160']function onlineToOffline({ dataSource, theme, color = ['#41c669', '#ff6160'] }) {const _options = {color,xAxis: {min: 0, // x轴零刻度对应的实际值},yAxis: {// type: 'category',// boundaryGap: false,// data: dataSource.map(it => it.label), // ['REDIS', 'ECS']axisTick: {lineStyle: { color: '#c1c5ca41' },alignWithLabel: true,},splitLine: { show: false },axisLine: { lineStyle: { color: 'rgba(0,0,0,0)' } },axisLabel: { color: '#9da5b2', fontSize: 11, overflow: 'break' },},series: [// 用 空bar来显示图例{ name: state[0], type: 'bar', data: [] },{ name: state[1], type: 'bar', data: [] },{type: 'custom',renderItem: (params, api) => {const categoryIndex = api.value(0);const start = api.coord([api.value(1), categoryIndex]);const end = api.coord([api.value(2), categoryIndex]);const height = 24;return {type: 'rect',shape: echarts.graphic.clipRectByRect({x: start[0],y: start[1] - height / 2,width: end[0] - start[0],height,},{x: params.coordSys.x,y: params.coordSys.y,width: params.coordSys.width,height: params.coordSys.height,}),style: api.style(),};},encode: {x: [1, 2],y: 0,},data: [{itemStyle: { normal: { color: color[0] } },name: state[0],value: [0, 0, 45],},{itemStyle: { normal: { color: color[1] } },name: state[1], // 离线value: [0, 45, 50],},{itemStyle: { normal: { color: color[0] } },name: state[0],value: [0, 50, 60],},],},],tooltip: {trigger: 'axis',backgroundColor: 'rgba(50,50,50,.8)',textStyle: {fontSize: 12,color: '#ccc',},enterable: true,extraCssText: 'max-height: 300px; overflow: auto;',appendToBody: true,},legend: {data: state,icon: 'rect',top: -4,itemWidth: 12,itemHeight: 8,textStyle: {fontSize: 12,color: theme === 'dark' ? '#fff' : '#333',},selectedMode: false, // 图例设为不可点击},grid: {top: 32,right: 8,bottom: 0,left: 0,containLabel: true, // 防止标签溢出},};return _options;}export default onlineToOffline;

若有收获,就点个赞吧
0 人点赞
