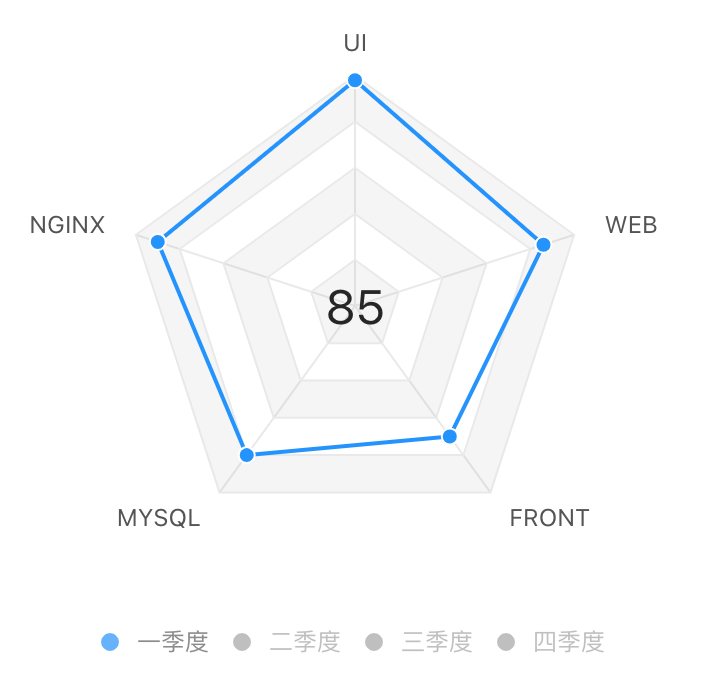
雷达图参考 https://bizcharts.alibaba-inc.com/product/bizcharts/demo/130
import React, { memo } from 'react';import PropTypes from 'prop-types'import {Chart,Geom,Axis,Tooltip,Coord,Legend,Guide,} from 'bizcharts';const { Html } = Guideconst scale = {score: {min: 0,max: 100,},user: {formatter: val => {return ({ '1': '一季度', '2': '二季度', '3': '三季度', '4': '四季度' }[val])}},};RadarChart.propTypes = {dataSource: PropTypes.array.isRequired,onLegendItemClick: PropTypes.func.isRequired,quarter: PropTypes.number.isRequired,padding: PropTypes.array,height: PropTypes.number,}function RadarChart(props) {const {dataSource, onLegendItemClick, padding = [24, 24, 48, 24], height = 360, quarter} = propsreturn (<ChartforceFitdata={dataSource}height={height}padding={padding}scale={scale}filter={[['user', val => val === String(quarter)]]}onLegendItemClick={onLegendItemClick}><Coord type="polar" radius={0.8} /><Tooltip /><Axisname="item"line={null}tickLine={null}grid={{lineStyle: {lineDash: null,},hideFirstLine: false,}}/><Axisname="score"line={null}tickLine={null}label={null}grid={{type: 'polygon',lineStyle: {lineDash: null,},alternateColor: 'rgba(0, 0, 0, 0.04)',}}/><Legendname="user"marker="circle"offset={30}selectedMode="single"/><Guide><Htmlposition={['50%', '50%']}html={(_, score) => {const { values } = score.score || []return nodeString(values)}}alignX="middle"alignY="middle"/></Guide><Geom type="line" position="item*score" color="user" size={2} /><Geomtype="point"position="item*score"color="user"shape="circle"size={4}style={{stroke: '#fff',lineWidth: 1,fillOpacity: 1,}}/></Chart>);}export default memo(RadarChart)// Guide.Htmlfunction nodeString(values) {let avg = values.reduce((prev, next) => prev + next, 0) / values.length;avg = Math.round(avg * 100 / 100)return `<div style=color:#8c8c8c;text-align: center;width: 10em;><b style=color:#262626;font-size:24px>${avg}</b></div>`}
radar数据格式
export const radarData = [{ 'item': 'UI设计', 'user': '1', 'score': 0, key: 'UI' },{ 'item': 'UI设计', 'user': '2', 'score': 0, key: 'UI' },{ 'item': 'UI设计', 'user': '3', 'score': 0, key: 'UI' },{ 'item': 'UI设计', 'user': '4', 'score': 0, key: 'UI' },{ 'item': 'WEB', 'user': '1', 'score': 0, key: 'WEB' },{ 'item': 'WEB', 'user': '2', 'score': 0, key: 'WEB' },{ 'item': 'WEB', 'user': '3', 'score': 0, key: 'WEB' },{ 'item': 'WEB', 'user': '4', 'score': 0, key: 'WEB' },{ 'item': 'FRONT', 'user': '1', 'score': 0, key: 'FRONT' },{ 'item': 'FRONT', 'user': '2', 'score': 0, key: 'FRONT' },{ 'item': 'FRONT', 'user': '3', 'score': 0, key: 'FRONT' },{ 'item': 'FRONT', 'user': '4', 'score': 0, key: 'FRONT' },{ 'item': 'MYSQL', 'user': '1', 'score': 0, key: 'MYSQL' },{ 'item': 'MYSQL', 'user': '2', 'score': 0, key: 'MYSQL' },{ 'item': 'MYSQL', 'user': '3', 'score': 0, key: 'MYSQL' },{ 'item': 'MYSQL', 'user': '4', 'score': 0, key: 'MYSQL' },{ 'item': 'NGINX', 'user': '1', 'score': 0, key: 'NGINX' },{ 'item': 'NGINX', 'user': '2', 'score': 0, key: 'NGINX' },{ 'item': 'NGINX', 'user': '3', 'score': 0, key: 'NGINX' },{ 'item': 'NGINX', 'user': '4', 'score': 0, key: 'NGINX' },];

若有收获,就点个赞吧
0 人点赞
