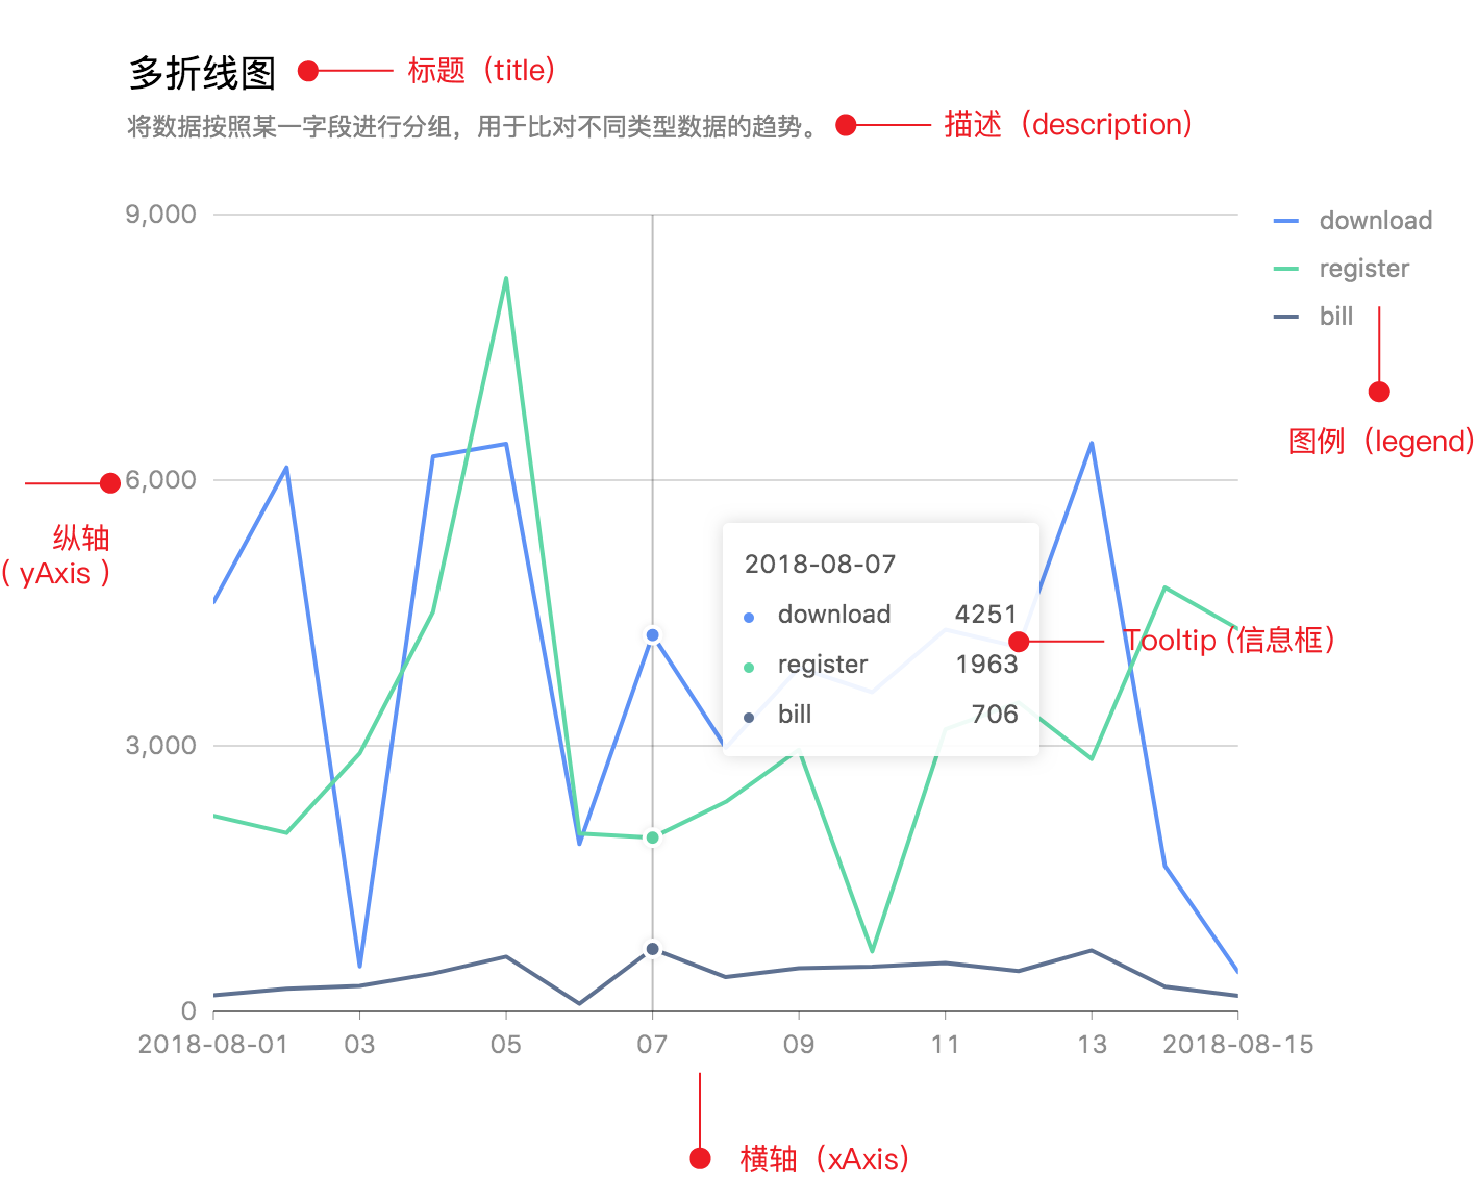

<Chartheight={200}data={dataSource}title={{visible: true,text: '折线图',}}description={{visible: true,text: '用平滑的曲线代替折线。',}}xField='year'yField='value'// interactions={[// {// type: 'slider',// cfg: {// start: 0,// end: 1,// },// },// ]}/>
yAxis
修改 grid为虚线
bizchart4 修改网格线为虚线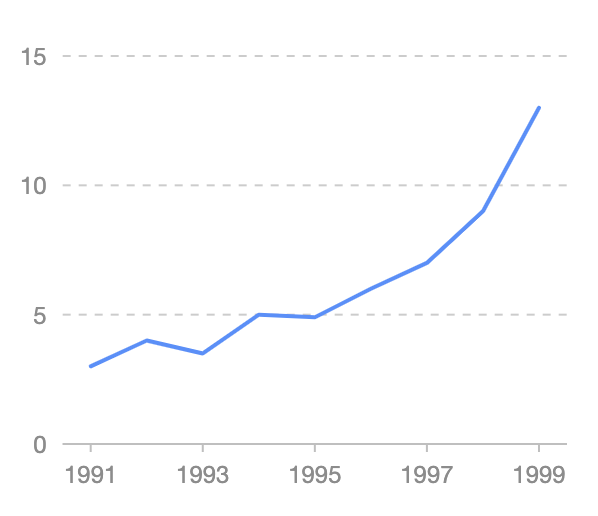
<ChartyAxis: {grid: {line: {style: {stroke:'#ccc',lineDash: [4, 4],},}, // 设置坐标系栅格样式},},>
lineStyle
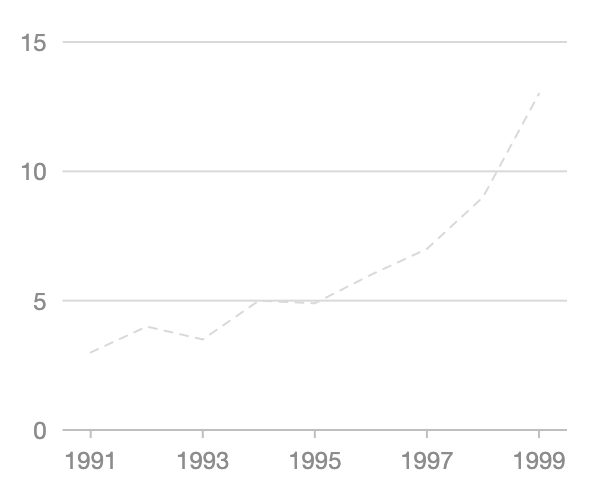
<ChartlineStyle:{stroke: '#d9d9d9', // 网格线的颜色lineWidth: 1, // 网格线的宽度复制代码lineDash: [4, 4] // 网格线的虚线配置,第一个参数描述虚线的实部占多少像素,第二个参数描述虚线的虚部占多少像素// lineDash: 1 //设置网格线类型 dotted:虚线 solid:实线}>

若有收获,就点个赞吧
0 人点赞
