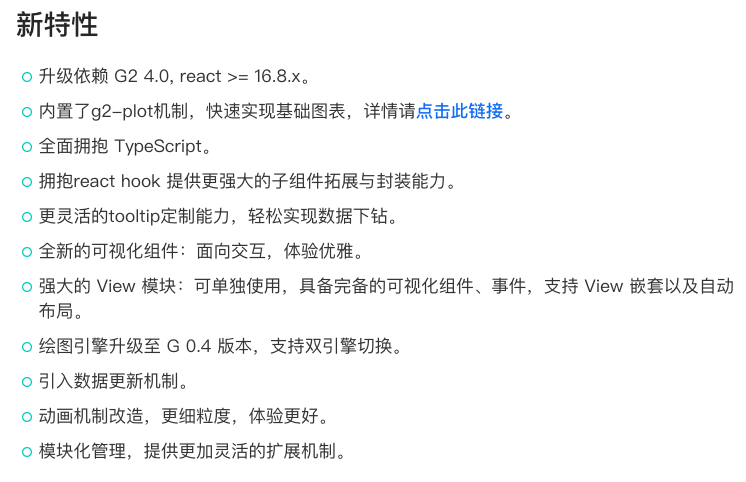
基于 G2与G2Plot封装的React图表库, React-Antd技术栈
bizchart网站 https://bizcharts.net
bizchart鱼雀文档 https://www.yuque.com/antv/g2-docs/api-geom#label
bizcharts4x和 3x的区别
https://bizcharts.net/product/BizCharts4/category/61/page/104
折线图缩放
- bizchart@3.5.8 暂时不支持 4.x版本
- 缩放用到g2-brush
- 折线图缩放案例:https://codepen.io/fengyue/pen/WNNwJEZ?editors=1010
import React from 'react';import { Axis, Chart, Geom, Tooltip } from 'bizcharts';import Brush from '@antv/g2-brush';import dayJs from 'dayjs';export default class LineChart extends React.Component {static defaultProps = {data: [],padding: 'auto',className: '',};componentDidUpdate = () => {if (this.chart && !this.brush) {this.brush = new Brush({canvas: this.chart.get('canvas'),chart: this.chart,type: 'X',onBrushstart() {this.chart.hideTooltip();},onBrushmove() {this.chart.hideTooltip();},});}};processData = (data = []) => {return data.map(item => {item.time = `${dayJs(item.time).format('YYYY-MM-DD HH:mm')}`;return item;});};render() {const { height, data, padding, className } = this.props;const scale = {value: { min: 0 },time: { tickCount: 20 },};return (<div className={`g-flexbox g-justify-center ${className}`}><ChartforceFitonGetG2Instance={g2Chart => {g2Chart.animate(false);this.chart = g2Chart;}}scale={scale}padding={padding}height={height}data={this.processData(data)}><Axis name="time" /><Axis name="value" /><Geom type="line" position="time*value" size={2} shape="smooth" /><Tooltip shared /></Chart></div>);}}
legend图例
- legend API文档 https://bizcharts.net/product/bizcharts/category/7/page/29#g2
- 自定义图例形状 https://bizcharts.net/product/bizcharts/category/7/page/29#custom
折柱混合图表
const legendItem = [{value: "百分比", // percentmarker: {symbol: "square",fill: "#3182bd", // 深蓝radius: 5}},{value: "总量", // totalfill: '#99d8c9',marker: {symbol: "hyphen",stroke: "#ffae6b",radius: 5,lineWidth: 3}},{value: "已使用", // usedfill: '#fdae6b',marker: {symbol: "hyphen",stroke: "#336699",radius: 5,lineWidth: 3}}]let chartIns = nullconst padding = [32, 16, 64, 48]const data = [{time: "10:16",percent: 90,total: 600,used: 200}]const scale = {util: {alias: "使用率",type: "linear",formatter: val => `${val}%`,tickCount: 5,ticks: [0, 25, 50, 75, 100]},total: {alias: "总量",type: "linear",},used: {alias: "已使用",type: "linear",}}class LineBar extends React.PureComponent {render() {return (<ChartautoFitpadding={padding}scale={scale}data={data}height={360}onGetG2Instance={chart => {chartIns = chart}}><Legendcustom={true}allowAllCanceled={true}items={legendItem}onClick={ev => {const item = ev.item;const value = item.value;const checked = ev.checked;const geoms = chartIns.getAllGeoms();for (let i = 0; i < geoms.length; i++) {const geom = geoms[i];if (geom.getYScale().field === value) {if (checked) {geom.show();} else {geom.hide();}}}}}/><Axisname="used"grid={null}label={{textStyle: {fill: "#fdae6b"}}}/><Tooltip /><Geom type="interval" position="time*util" color="#3182bd" /><Geomtype="line"position="time*total"color="#9900ff"size={3}shape="smooth"/><Geomtype="line"position="time*free"color="#fdae6b"size={3}shape="smooth"/></Chart>)}}export default LineBar

