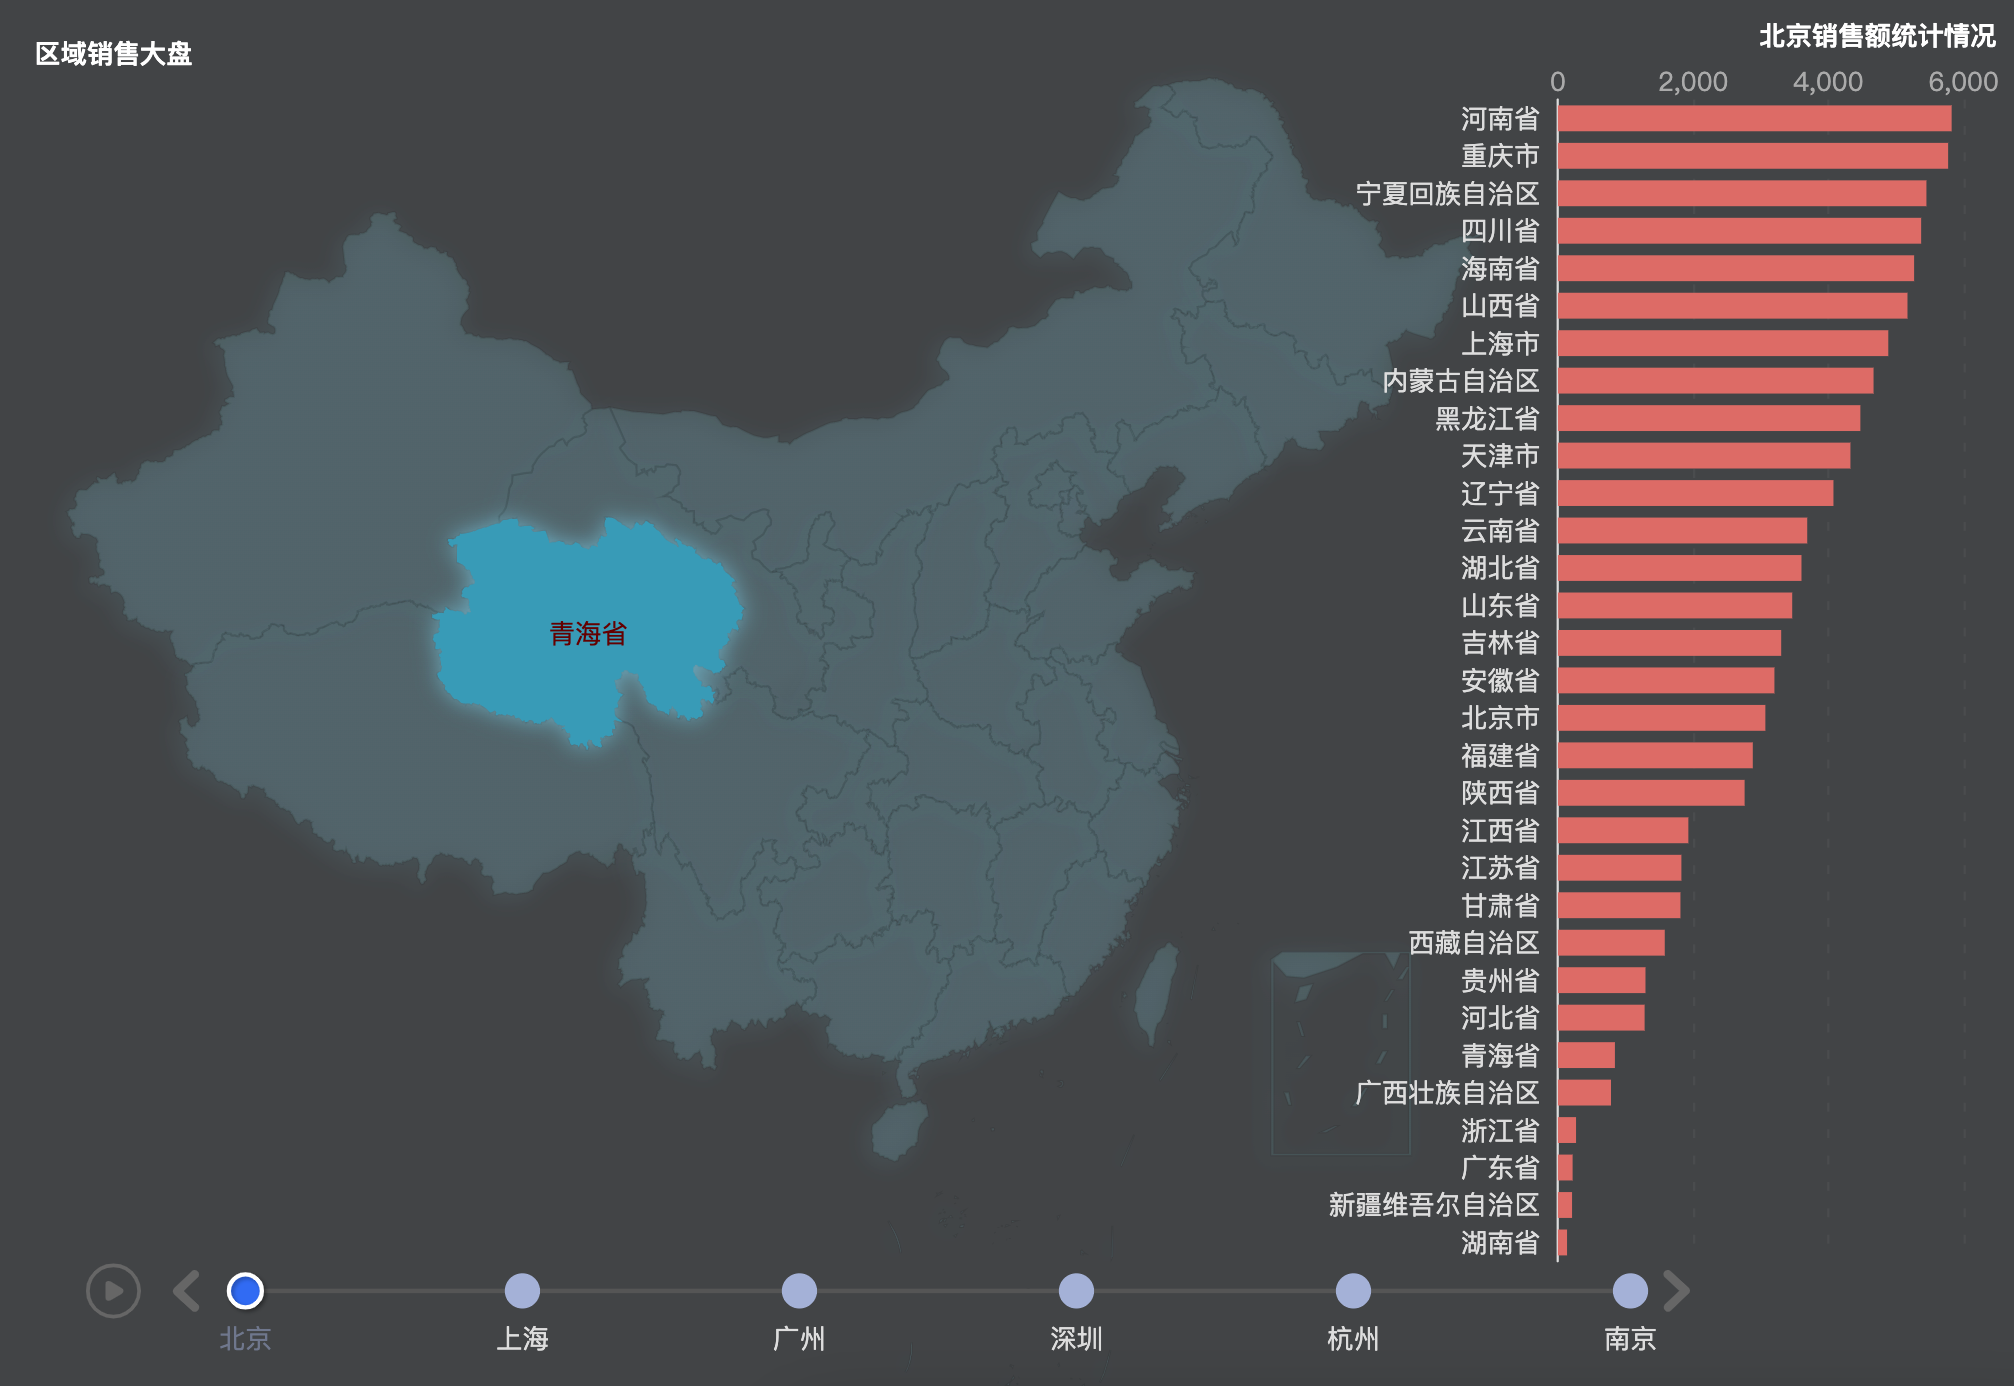
timelineOption
import * as echarts from 'echarts';import {chinaJson} from '@/components/ECharts/Map';import { getData, colors, provinces } from './_data';const cities = ['北京', '上海', '广州', '深圳', '杭州', '南京'];const mapData = cities.map((it, i) => []);const series = { data1: getData(10, 6000), data2: getData(10, 7000), data3: getData(10, 8000), data4: getData(10, 9000), data5: getData(100, 6000), data6: getData(100, 3000),}function chinaOption() { echarts.registerMap('china', chinaJson); // 时间轴 const timeline = { data: cities, axisType: 'category', // 坐标轴类型 realtime: true, // 拖动时是否实时渲染视图 rewind: false, // 是否启动反向播放,需要将loop置为true // loop: false, // 是否循环播放 autoPlay: false, // 是否自动播放 currentIndex: 0, // 起始位置 // playInterval:3000, // 播放间隔 left: 40, // timeline的位置 bottom: 24, width: '80%', label: { // 文字样式控制 normal: { textStyle: { color: '#ddd'} }, emphasis: { textStyle: { color: '#fff'} } }, // 以下都是 timeline的样式 symbolSize: 16, lineStyle: { color: '#555' }, checkpointStyle: { // 选中的样式 borderColor: '#fff', borderWidth: 2 }, controlStyle: { // 左右箭头控制 showNextBtn: true, showPrevBtn: true, normal: { color: '#666', borderColor: '#666' }, emphasis: { color: '#fff', borderColor: '#fff' } } }; // 柱图数据 [[], [], [], [], [], []] provinces.forEach((item, index) => { const key = item.name; mapData.forEach((child, i) => { const {value} = series[`data${i+1}`].find(it => it.name === key) || {}; child.push({ name: key, value }) child.sort((a,b) => a.value - b.value) }) }); // 柱图 X轴数据 [[], [], [], [], [], []] const xdata = cities.map((it, i) => { return mapData[i].map(it => it.name); }); const barData = cities.map((it, i) => { return mapData[i].map(it => it.value); }); const config = { timeline, baseOption: { backgroundColor: '#424446', // 动画设置 animation: true, animationDuration: 500, animationDurationUpdate: 500, animationEasing: 'linear', animationEasingUpdate: 'linear', universalTransition: true, grid: { right: 24, top: 48, // bottom: 24, width: '20%', // containLabel: true, }, tooltip: { trigger: 'axis', // hover触发器 axisPointer: { // 坐标轴指示器,坐标轴触发有效 type: 'shadow', // 默认为直线,可选为:'line' | 'shadow' shadowStyle: { color: 'rgba(150,150,150,0.1)' // hover颜色 } } }, xAxis: { type: 'value', // scale: true, position: 'top', splitNumber: 3, boundaryGap: false, splitLine: { interval: 1, lineStyle: { type: [4, 8], // dashOffset: 5, color: 'rgba(170,170,170,0.08)', } }, axisLine: { show: false }, axisTick: { show: false }, axisLabel: { // show: false, margin: 2, interval: 1, textStyle: { color: '#aaa' } } }, yAxis: { type: 'category', // name: 'TOP 20', nameGap: 16, axisLine: { show: true, lineStyle: { color: '#ddd' } }, axisTick: { show: false, lineStyle: { color: '#ddd' } }, axisLabel: { interval: 0, textStyle: { color: '#ddd' } }, data: provinces.map(it => it.name) }, // 地图设置 geo: { map: "china", roam: true, zoom: 1.35, scaleLimit: { min: 1, max: 2 }, top: '10%', // 地图的位置 left: '16%', center: [107.032858,33.079788], tooltip: {show: false}, label: { normal: { show: false, fontSize: 12, color: "rgba(0,0,0,0.65)" } }, itemStyle: { normal: { borderColor: "rgba(0, 0, 0, 0.08)", borderWidth: 1, // 默认 0 // https://echarts.apache.org/zh/option.html#color areaColor: { type: 'radial', x: 1.13, y: 1.5, r: 0.8, colorStops: [{ offset: 0, color: 'rgba(147, 235, 248, 0.005)' // 0% 的颜色 }, { offset: 1, color: 'rgba(147, 235, 248, 0.13)' // 100% 的颜色 }], globalCoord: false // 缺省为 false }, shadowColor: 'rgba(128, 217, 248, .65)', // shadowColor: 'rgba(255, 255, 255, 1)', shadowOffsetX: -2, shadowOffsetY: 2, shadowBlur: 10 }, emphasis: { areaColor: '#389BB7', // 鼠标选择区域颜色 color: '#fff', shadowOffsetX: 0, shadowOffsetY: 0, borderWidth: 0 } }, }, }, options: [], } // options[] 里面的每一项会合并 baseOption cities.forEach((item, i) => { const rowData = { title: [ { text: '区域销售大盘', left: 16, top: 16, textStyle: { color: '#fff', fontSize: 12, } }, { id: 'statistic', text: `${item}销售额统计情况`, top: 8, right: 4, textStyle: { color: '#fff', fontSize: 12 } } ], yAxis: { data: xdata[i], // data: provinces.map(it => it.name), // Y轴不变,柱图会平滑过渡 }, series: [ { zlevel: 1.5, type: 'bar', data: barData[i], itemStyle: { normal: { color: colors[3][i] } }, } ] } config.options.push(rowData); }); return config;}export default chinaOption;
randomValue
import provinces from './provinces.json';export function randomValue(min=0, max=100) { return Math.floor(Math.random() * (max - min)) + min}export { provinces }export const colors = [ ['#1DE9B6', '#1DE9B6', '#FFDB5C', '#FFDB5C', '#04B9FF', '#04B9FF'], ['#1DE9B6', '#F46E36', '#04B9FF', '#5DBD32', '#FFC809', '#FB95D5', '#BDA29A', '#6E7074', '#546570', '#C4CCD3'], ['#37A2DA', '#67E0E3', '#32C5E9', '#9FE6B8', '#FFDB5C', '#FF9F7F', '#FB7293', '#E062AE', '#E690D1', '#E7BCF3', '#9D96F5', '#8378EA', '#8378EA'], ['#DD6B66', '#759AA0', '#E69D87', '#8DC1A9', '#EA7E53', '#EEDD78', '#73A373', '#73B9BC', '#7289AB', '#91CA8C', '#F49F42']]export function getData(min, max) { return provinces .map((item) => { return {...item, value: randomValue(min, max)} }) .sort((a, b) => a.value - b.value);}


