全球 geoJson
https://blog.csdn.net/qq_42566295/article/details/81132823
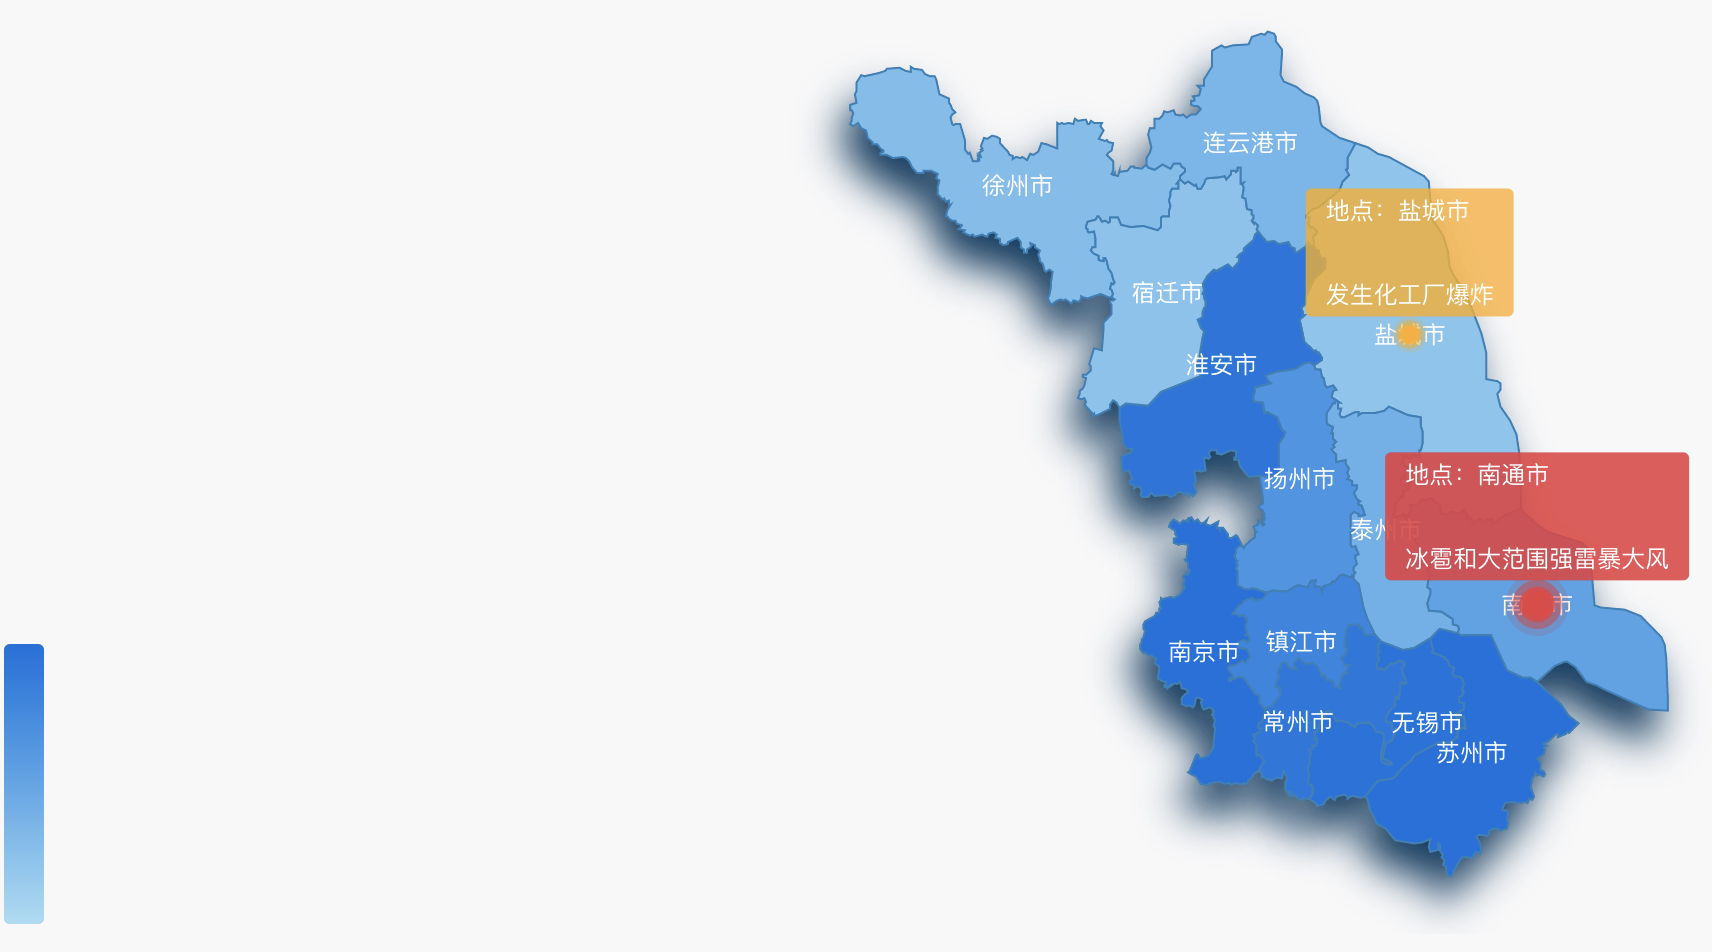
省市区事件预警可视化

<template><div class="chart" ref="box"/></template><script>import {onMounted, getCurrentInstance, defineComponent} from 'vue';import { ProvinceData } from 'china-map-geojson';import * as echarts from 'echarts/core';import {TitleComponent,ToolboxComponent,TooltipComponent,VisualMapComponent,GeoComponent} from 'echarts/components';import {MapChart} from 'echarts/charts';import {CanvasRenderer} from 'echarts/renderers';echarts.use([TitleComponent, ToolboxComponent, TooltipComponent,VisualMapComponent, GeoComponent, MapChart, CanvasRenderer]);const cityCenter = ProvinceData.Jiangsu.features.map((item) => {const { name, cp } = item.propertiesreturn { name, cp, value: Math.random() * 100 }});export default defineComponent({setup() {onMounted(() => {const { ctx } = getCurrentInstance();const element = ctx.$refs.box;// 基于准备好的dom,初始化echarts实例const myChart = echarts.init(element);// 注册地图echarts.registerMap('Jiangsu', ProvinceData.Jiangsu);// 绘制图表myChart.setOption({visualMap: [{ // 地图视觉映射type: 'continuous',show: true,max: 100,seriesIndex: [0], // mapinRange: {color: ['#a5dcf4', '#006edd']}}],geo: [ // 地图的基本配置{map: 'Jiangsu',roam: false, // 是否允许鼠标滚轮缩放zoom: 1.1, // 默认显示级别// geoIndex: -1,scaleLimit: { // 缩放级别min: 0,max: 3},itemStyle: { // 阴影效果normal: {areaColor: '#013C62',shadowColor: '#013C62',shadowBlur: 20,shadowOffsetX: -5,shadowOffsetY: 15}}}],series: [{ // 地图的高级配置,会覆盖 geo的配置,双地图有阴影效果type: 'map',mapType: 'Jiangsu',geoIndex: 1,scaleLimit: { // 缩放级别min: 0, max: 3},roam: false,zoom: 1.1, // 默认显示级别label: {show: true,color: '#fff',emphasis: {color: '#fff'}},itemStyle: {normal: {borderColor: '#2980b9',borderWidth: 1,areaColor: '#12235c'},emphasis: {areaColor: '#fa8c16',borderWidth: 0,}},data: cityCenter},{type: 'effectScatter',coordinateSystem: 'geo',// value 必须是个极坐标系data: [{ value: cityCenter[0].cp, city: cityCenter[0].name }],z: 5,symbolSize: 8,label: {normal: {show: true,formatter (params) {const { city, info } = params.datareturn `{fline|地点:${city}}\n{tline|${info || '发生化工厂爆炸'}}`;},position: 'top',backgroundColor: 'rgba(254,174,33,.8)',padding: [0, 0],borderRadius: 3,lineHeight: 32,color: '#f7fafb',rich: {fline: {padding: [0, 10, 10, 10],color: '#fff'},tline: {padding: [10, 10, 0, 10],color: '#fff'}}},emphasis: {show: true}},itemStyle: {color: '#feae21',// color: '#fff'}},{type: 'effectScatter',coordinateSystem: 'geo',z: 5,data: [{ value: cityCenter[2].cp, city: cityCenter[2].name }],symbolSize: 14,label: {normal: {show: true,formatter (params) {const { city, info } = params.datareturn `{fline|地点:${city}}\n{tline|${info || '冰雹和大范围强雷暴大风'}}`;},position: 'top',backgroundColor: 'rgba(233,63,66,.9)',padding: [0, 0],borderRadius: 3,lineHeight: 32,color: '#fff',rich: {fline: {padding: [0, 10, 10, 10],color: '#fff'},tline: {padding: [10, 10, 0, 10],color: '#fff'}}},emphasis: {show: true}},itemStyle: {color: '#e93f42'}},]});});},});</script><style scoped>.chart {height: 480px;}</style>

