双Y轴 Axis
Tooltip
format
https://bizcharts.net/product/BizCharts4/demo/474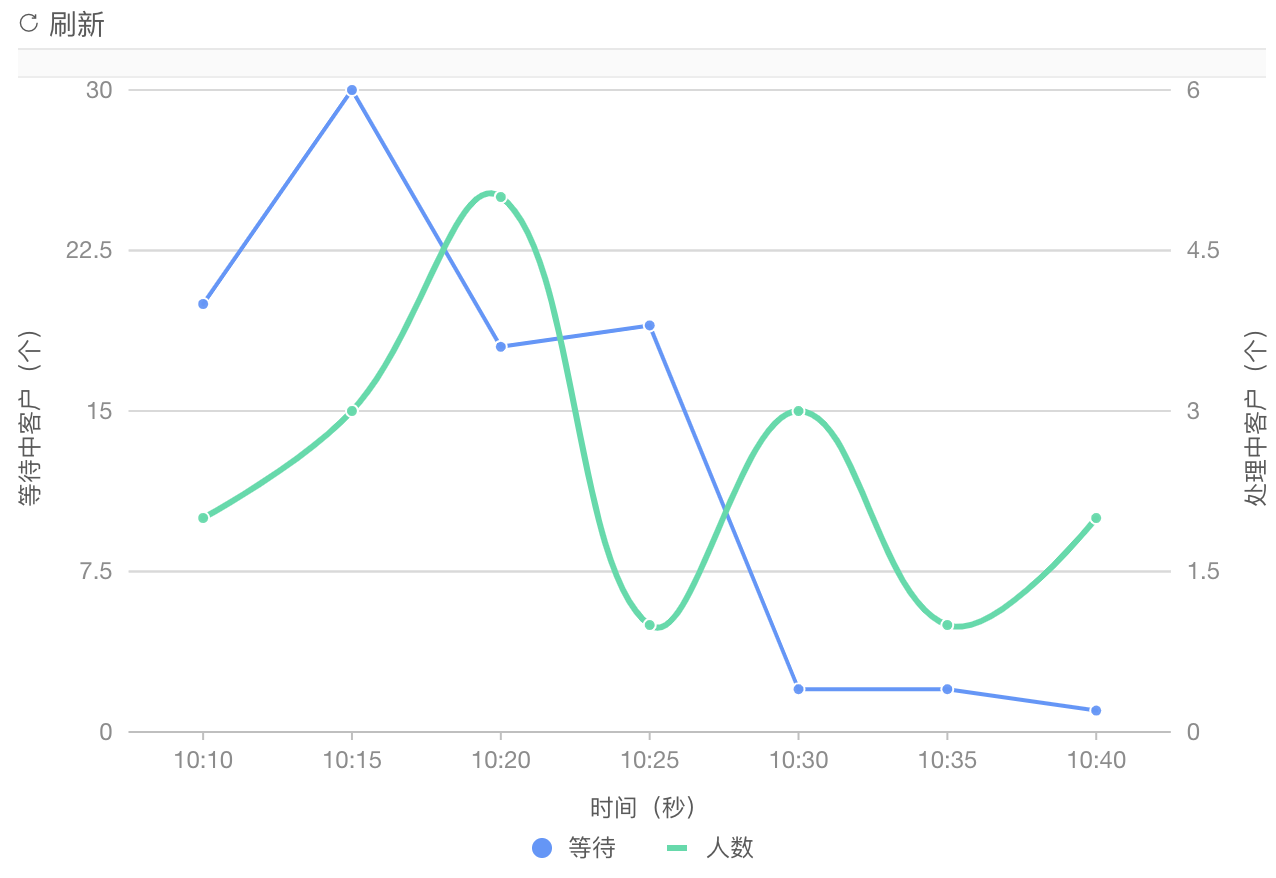
import React from "react";import {G2,Chart,Geom,Axis,Tooltip,Coord,Label,Legend,View,Guide,Shape,Facet,Util,Point,Line,Interval,} from "bizcharts";import moment from "moment";class LineChart extends React.Component {render() {const data = [{time: "2020-07-02 10:10",call: 4,waiting: 20,people: 2,},{time: "2020-07-02 10:15",call: 2,waiting: 30,people: 3,},{time: "2020-07-02 10:20",call: 13,waiting: 18,people: 5,},{time: "2020-07-02 10:25",call: 9,waiting: 19,people: 1,},{time: "2020-07-02 10:30",call: 5,waiting: 2,people: 3,},{time: "2020-07-02 10:35",call: 8,waiting: 2,people: 1,},{time: "2020-07-02 10:40",call: 13,waiting: 1,people: 2,},];let chartIns = null;const scale = {// tickCount控制双轴的对齐people: {alias: "处理中客户(个)",tickCount: 5,min: 0,type: 'linear-strict'// (⚠️需要更新至4.1.x版本才能使用)},waiting: {alias: "等待中客户(个)",tickCount: 5,min: 0,type: 'linear-strict'},time: {alias: "时间(秒)",// type: 'timeCat',// mask: 'YYYY-MM-DD HH:mm:ss'},};const colors = ["#6394f9", "#62daaa"];const axisLabel = {formatter(text, item, index) {// return moment(text).format('YYYY-MM-DD HH:mm:ss')console.log("axisLabel", text);return moment(text).format("HH:mm");},};return (<Chartscale={scale}autoFitheight={400}data={data}onGetG2Instance={(chart) => {chartIns = chart;}}><Axis name="waiting" title /><Axis name="people" title /><Axis name="time" title label={axisLabel} /><Legendcustom={true}allowAllCanceled={true}items={[{value: "waiting",name: "等待",marker: {symbol: "circle",style: { fill: colors[0], r: 5 },},},{value: "people",name: "人数",marker: {symbol: "hyphen",style: { stroke: colors[1], r: 5, lineWidth: 3 },},},]}onChange={(ev) => {console.log("ev", ev);const item = ev.item;const value = item.value;const checked = !item.unchecked;const geoms = chartIns.geometries;for (let i = 0; i < geoms.length; i++) {const geom = geoms[i];if (geom.getYScale().field === value) {if (checked) {geom.show();} else {geom.hide();}}}}}/><Tooltip shared showCrosshairs />{/*API参考文档 https://pre-bxs.alibaba-inc.com/product/bizcharts/category/7/page/27#tooltip*/}<Lineposition="time*waiting"color={colors[0]}tooltip={["time*waiting",(time, waiting) => {console.log("waiting", waiting);const myTitle = moment(time).format("MM-DD HH:mm");return {name: "等待中客户",value: `${waiting} 人`,title: myTitle,};},]}/><Pointposition="time*waiting"color={colors[0]}size={3}shape="circle"tooltip={false}/><Lineposition="time*people"color={colors[1]}size={3}shape="smooth"tooltip={["time*people",(time, people) => {console.log("people", people);const myTitle = moment(time).format("MM-DD HH:mm");return {name: "处理中客户",value: `${people} 人`,title: myTitle,};},]}/><Pointposition="time*people"color={colors[1]}size={3}shape="circle"tooltip={false}/></Chart>);}}export default LineChart

若有收获,就点个赞吧
0 人点赞
