bizchart折线图案例
https://bizcharts.alibaba-inc.com/product/BizCharts4/demo/399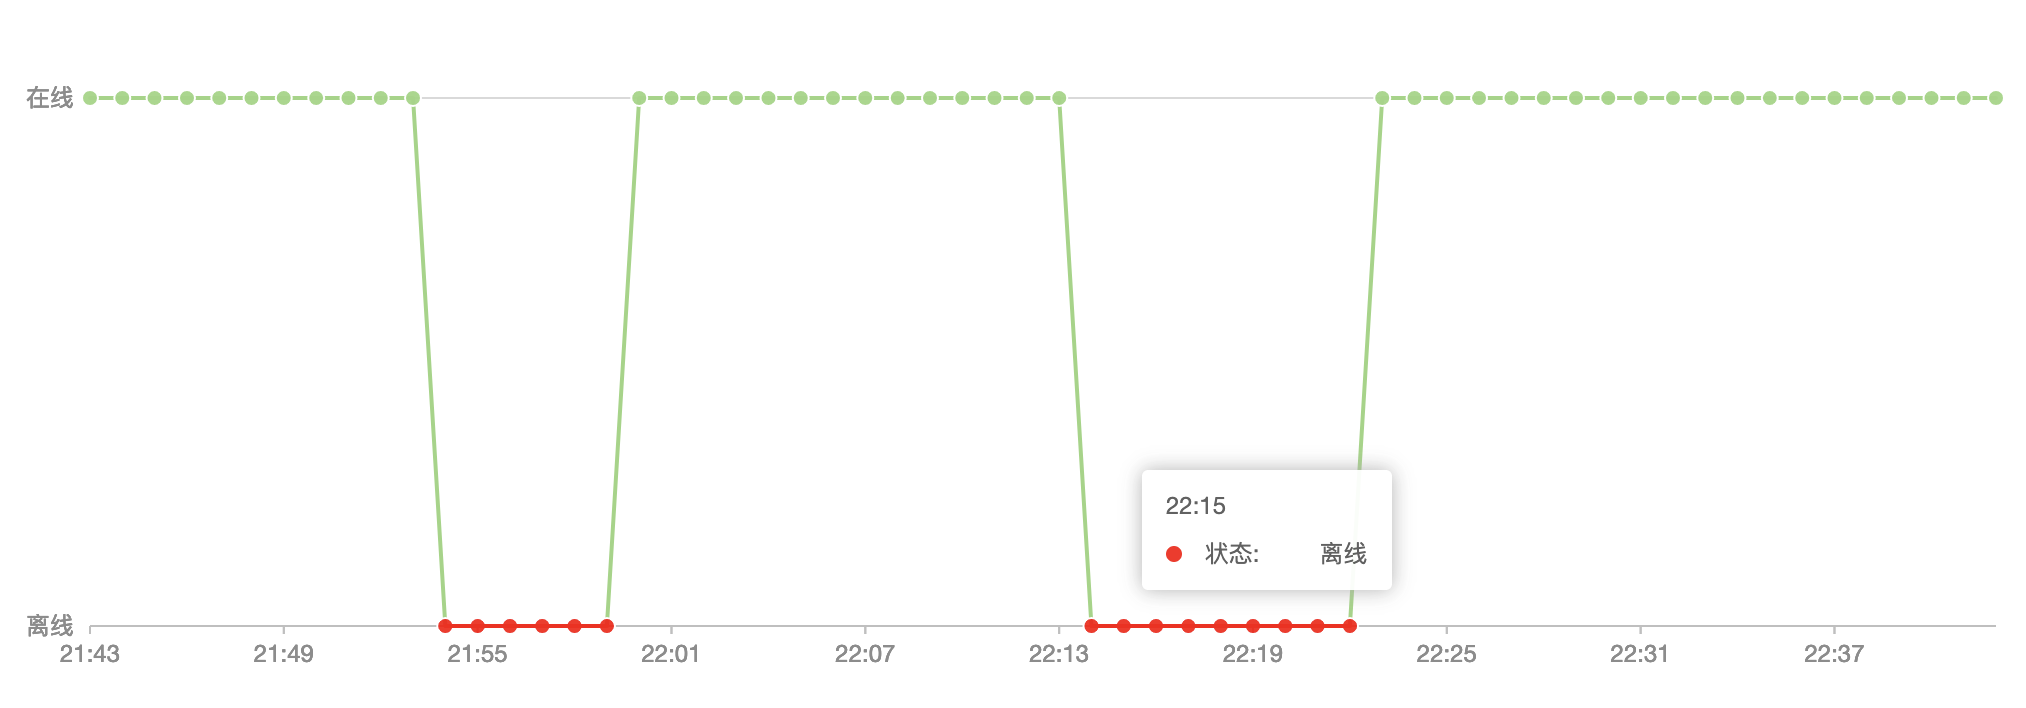
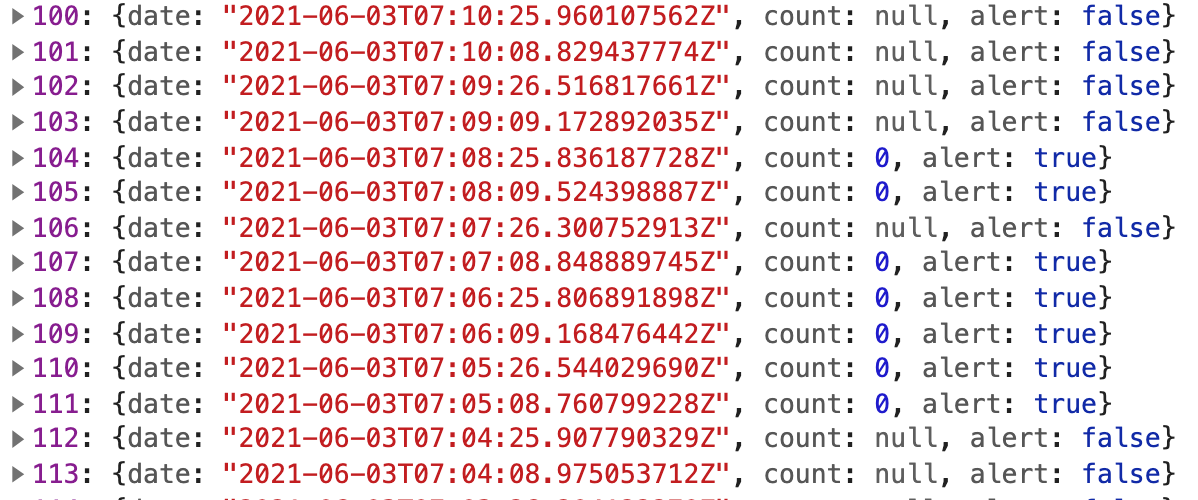
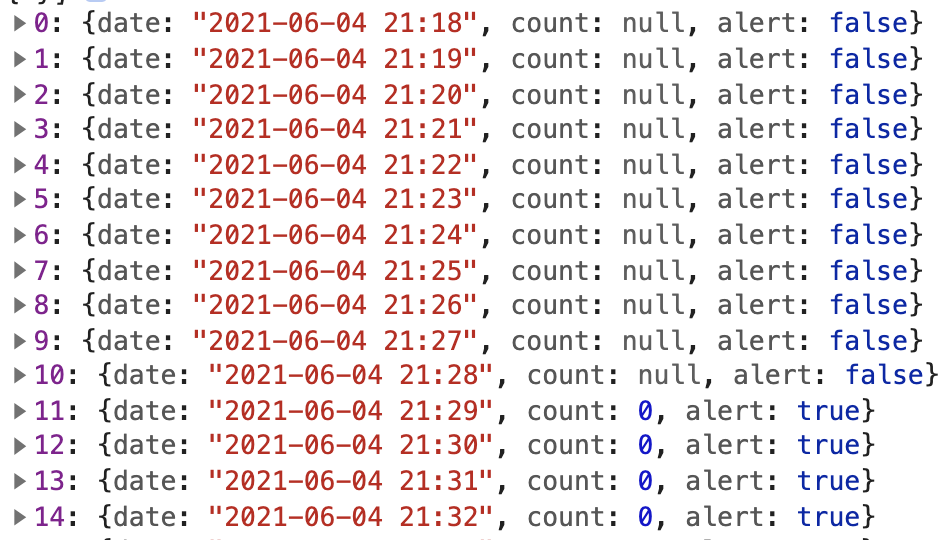
告警线数据
- 告警设置 alert: true, count: Number
- 不是告警的清除 count: null
bizchart3.8.0需要设置2个刻度
const scale = {date: {alias: "日期",type: "time",tickCount: 10,mask: 'HH:mm',},count: {alias: "状态",type: 'cat',values: ['离线', '在线'],range: [0, 1]},};const alertScale = {...scale,count: {alias: "状态",tickCount: 2,max: 1,min: 0,range: [0, 1]},}
bizchart4.x
import React from 'react';import PropTypes from 'prop-types';import {Chart,Line,Legend,Axis,Tooltip,Point,View,} from "bizcharts";const scale = {date: {alias: "日期",type: "time",tickCount: 10,mask: 'HH:mm',},count: {alias: "状态",type: 'cat',values: ['离线', '在线'],range: [0, 1]},};LineChart.propTypes = {dataSource: PropTypes.array.isRequired,height: PropTypes.number,padding: PropTypes.array,};LineChart.defaultProps = {height: 360,padding: [24, 16, 24, 24],}function LineChart({dataSource, height, padding}) {const alertLine = dataSource.map((item) => {return item.alert ? item : {...item, count: null};});return (<ChartautoFitheight={height}padding={padding}scale={{count: {sync: true,},}}className='mb32'><Tooltip /><View data={dataSource} scale={scale}><Axis name="count" /><Lineposition="date*count"color="#9AD681"size={2}tooltip={["count*alert",(count, alert) => {return {name: "状态",color: alert ? '#f00' : '#9AD681',value: count ? '在线' : '离线',};},]}/><Pointposition="date*count"shape='circle'color={["date*alert",(count, alert) => {return alert ? '#f00' : "#9AD681";},]}tooltip={false}/></View><View data={alertLine} scale={scale}><Lineposition="date*count"color="#f00"size={2}tooltip={false}/></View><Legend visible={false}/></Chart>);}export default LineChart;
滑块Bug
折线图,默认显示滑块,如何解决?
- bizChart4.x 用 Line 代替
https://bizcharts.net/product/BizCharts4/category/62/page/81#slidable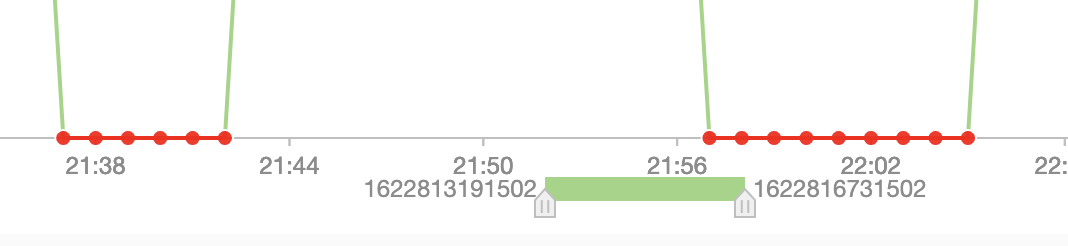
在 Chart里面设置:

若有收获,就点个赞吧
0 人点赞
