https://echarts.apache.org/examples/zh/editor.html?c=line-simple
js按需加载
import * as echarts from 'echarts/core';import { GridComponent } from 'echarts/components';import { LineChart } from 'echarts/charts';import { UniversalTransition } from 'echarts/features';import { CanvasRenderer } from 'echarts/renderers';echarts.use([GridComponent, LineChart, CanvasRenderer, UniversalTransition]);var chartDom = document.getElementById('main');var myChart = echarts.init(chartDom);var option;option = {xAxis: {type: 'category',boundaryGap: false,data: ['Mon', 'Tue', 'Wed', 'Thu', 'Fri', 'Sat', 'Sun']},yAxis: {type: 'value'},series: [{data: [150, 230, 224, 218, 335, 517, 260],type: 'line',symbol: 'none' // 去掉折线上面的小圆点}]};option && myChart.setOption(option);
自定义折线图
- 折线图颜色渐变
- 折线图宽度
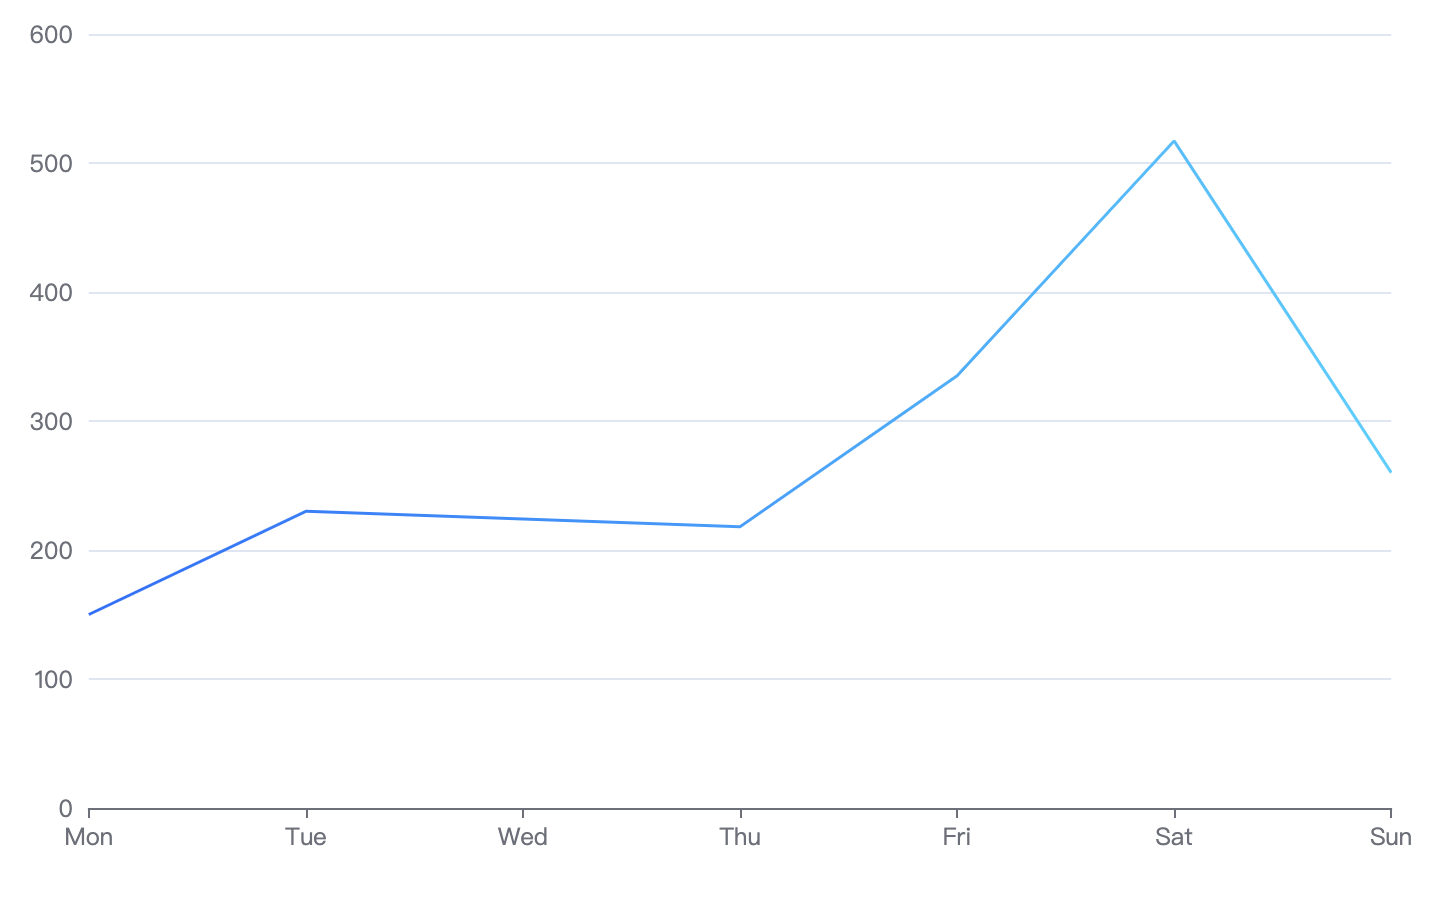
option = {xAxis: {type: 'category',boundaryGap: false,data: ['Mon', 'Tue', 'Wed', 'Thu', 'Fri', 'Sat', 'Sun']},yAxis: {type: 'value'},series: [{data: [150, 230, 224, 218, 335, 517, 260],type: 'line',symbol: 'none', // 去掉折线上面的小圆点itemStyle: {normal: {color: '#fff',fontSize: 14,lineStyle: {width: 1.5, //折线宽度//折线颜色渐变color: new echarts.graphic.LinearGradient(0, 0, 1, 0, [{offset: 0,color: 'rgba(45,105,249,1)'},{offset: 1,color: 'rgba(89,205,253,1)'}])}},emphasis: {//鼠标经过时折点小圆圈样式borderColor: 'rgba(0,196,132,0.2)',borderWidth: 4}}}]};

若有收获,就点个赞吧
0 人点赞
