dataset
DatasetComponent https://echarts.apache.org/examples/zh/editor.html?c=dataset-link&edit=1&reset=1
import { useEffect, useState } from 'react';import {array, number, string, oneOfType} from 'prop-types';import {DatasetComponent,TooltipComponent,GridComponent,LegendComponent} from 'echarts/components';import { BarChart } from 'echarts/charts';import { UniversalTransition } from 'echarts/features'import ECharts from '../../ECharts';import { getOption } from './rowBarChartOption'Chart.propTypes = {data: array,height: oneOfType([number, string]),className: string,};Chart.defaultProps = {height: 320,}function Chart({data, height, className}) {const [options, setOptions] = useState({})useEffect(update, [data])function update() {setOptions(getOption({data}))}const attrs = {// renderType: 'svg',className,height,options,components: [DatasetComponent,TooltipComponent,GridComponent,LegendComponent,BarChart,UniversalTransition]}return (<ECharts {...attrs} />);}export default Chart;
rowBarChartOption
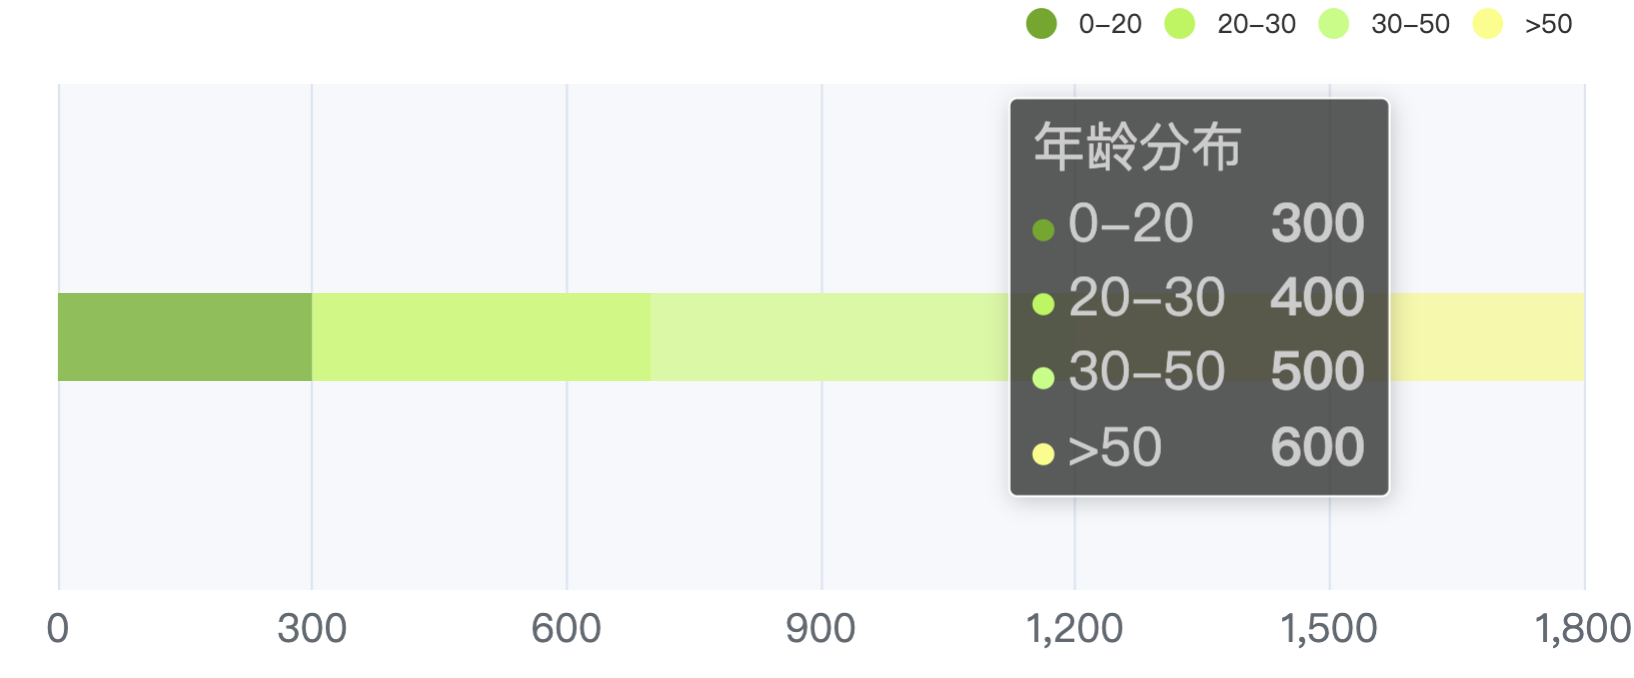
const color = ['rgb(116,166,49)', 'rgb(190,245,99)', 'rgb(202,252,137)', 'rgb(251,253,142)']export function getOption({data, length, theme}) {return {color,grid: {top: length === 1 ? 24 : 40,left: 24,right: 24,bottom: 24,containLabel: true,},dataset: {source: [['指标', '0-20', '20-30', '30-50', '50+'],['年龄分布', 300, 400, 500, 600]]},xAxis: {type: 'value',max: 1800,axisLine: {lineStyle: {color: 'rgb(50,51,53)',width: 3}},axisTick: { show: false },axisLabel: {color: 'rgb(98,105,113)',fontSize: 18}},yAxis: {type: 'category',show: false,},series: [{type: 'bar',stack: 'total',barMaxWidth: 40},{type: 'bar',stack: 'total'},{type: 'bar',stack: 'total'},{type: 'bar',stack: 'total'}],tooltip: {trigger: 'axis',backgroundColor: 'rgba(50,50,50, .8)',textStyle: {fontSize: 24, color: '#ccc',},enterable: true,axisPointer: {type: 'shadow'},extraCssText: 'max-height: 300px; overflow: auto;',},legend: {type: 'scroll',show: length !== 1,icon: 'circle',top: 0,right: 24,itemWidth: 24,textStyle: {color: theme === 'dark' ? '#fff' : '#333',},},};}

若有收获,就点个赞吧
0 人点赞
