bizcharts https://bizcharts.net/product/BizCharts4/demo/390
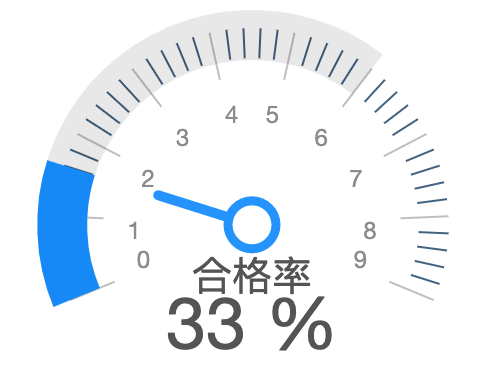
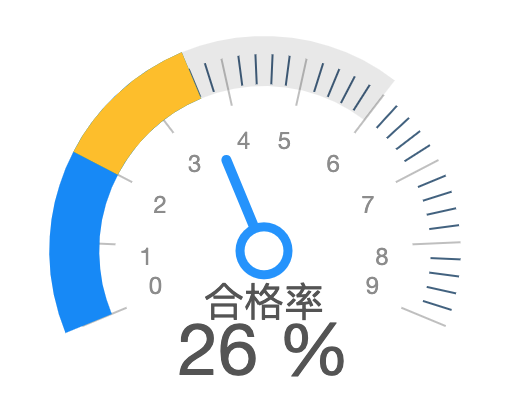
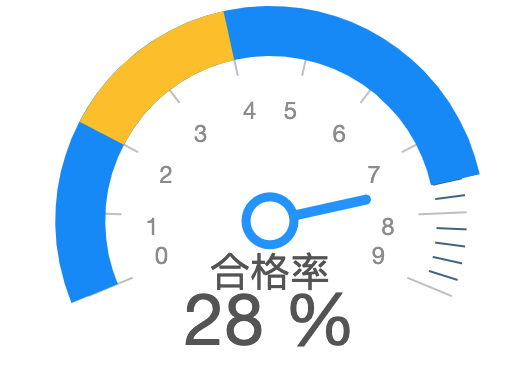
import React, { useState } from 'react';import { number } from 'prop-types';import { Chart, Axis, Coordinate, Annotation, Point, registerShape } from 'bizcharts';// 自定义Shape 部分registerShape('point', 'pointer', {draw(cfg, container) {const group = container.addGroup();const center = this.parsePoint({ // 获取极坐标系下画布中心点x: 0,y: 0,});// 绘制指针group.addShape('line', {attrs: {x1: center.x,y1: center.y,x2: cfg.x,y2: cfg.y,stroke: cfg.color,lineWidth: 5,lineCap: 'round',},});group.addShape('circle', {attrs: {x: center.x,y: center.y,r: 12,stroke: cfg.color,lineWidth: 4.5,fill: '#fff',},});return group;},});const color = ['#0086FA', '#FFBF00', '#F5222D'];GaugeChart.propTypes = {value: number,};// 仪表盘图function GaugeChart({ value }) {const [state, setState] = useState({ data: [{ value: 9.6 }], lineWidth: 12 });const val = state.data[0].value;return (<Chartheight={220}data={state.data}scale={{value: {min: 0,max: 9,tickInterval: 1,},}}padding={[0, 0, 30, 0]}autoFit><Coordinatetype='polar'startAngle={-9 / 8 * Math.PI}endAngle={1 / 8 * Math.PI}radius={0.75}/><Axisname='value'line={null}label={{offset: -36,textStyle: {fontSize: 18,fill: '#CBCBCB',textAlign: 'center',textBaseline: 'middle',},}}tickLine={{length: -24,stroke: '#fff',strokeOpacity: 1,}}subTickLine={{count: 4,length: -15,}}grid={null}/><Pointposition='value*1'color='#1890FF'shape='pointer'animate={{appear: {animation: 'fade-in',},}}/><Annotation.Arcstart={[0, 0.965]}end={[6, 0.965]}style={{ // 底灰色stroke: 'rgba(0, 0, 0, 0.09)',lineWidth: state.lineWidth,}}/>{val >= 2 &&<Annotation.ArczIndex={1}start={[0, 0.965]}end={[val, 0.965]}style={{ // 底灰色stroke: color[0],lineWidth: state.lineWidth,}}/>}{val >= 4 &&<Annotation.ArczIndex={1}start={[2, 0.965]}end={[4, 0.965]}style={{ // 底灰色stroke: color[1],lineWidth: state.lineWidth,}}/>}{val >= 4 && val < 6 &&<Annotation.ArczIndex={1}start={[4, 0.965]}end={[val, 0.965]}style={{ // 底灰色stroke: color[2],lineWidth: state.lineWidth,}}/>}{val >= 2 && val < 4 &&<Annotation.ArczIndex={1}start={[2, 0.965]}end={[val, 0.965]}style={{ // 底灰色stroke: color[1],lineWidth: state.lineWidth,}}/>}{val < 2 &&<Annotation.ArczIndex={1}start={[0, 0.965]}end={[val, 0.965]}style={{ // 底灰色stroke: color[0],lineWidth: state.lineWidth,}}/>}<Annotation.Textposition={['50%', '85%']}content='合格率'style={{fontSize: 20,fill: '#545454',textAlign: 'center',}}/><Annotation.Textposition={['50%', '90%']}content={`${val * 10} %`}style={{fontSize: 36,fill: '#545454',textAlign: 'center',}}offsetY={15}/></Chart>);}export default GaugeChart;
antd charts https://charts.ant.design/zh-CN/demos/gauge#%E4%BB%AA%E8%A1%A8%E7%9B%98
antv-g2Plot https://antv-g2plot.gitee.io/zh/examples/progress-plots/gauge#basic

若有收获,就点个赞吧
0 人点赞
