https://bizcharts.alibaba-inc.com/product/bizcharts/demo/22
g2-brush数据下钻折线图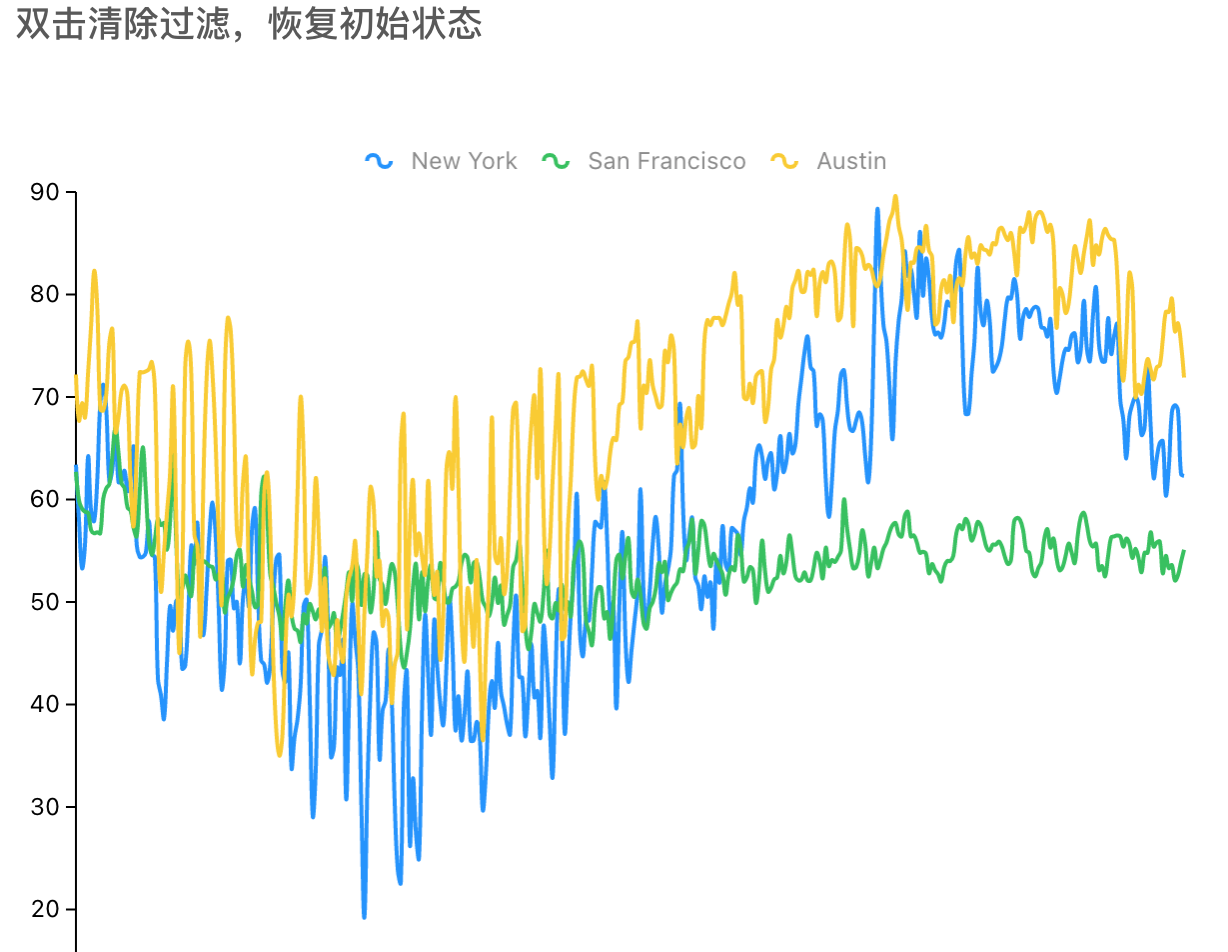
let chart;const scale = {value: {alias: '值',tickCount: 5,min: 0,},date: {type: 'timeCat',mask: 'YYYY-MM-DD HH:mm',tickCount: 8,nice: false,},};function App() {useEffect(init, []);function init() {new Brush({chart,canvas: chart.get('canvas');style: {fill: '#ccc',fillOpacity: 0.3,},type: 'X',onBrushstart() {chart.hideTooltip();},onBrushmove() {chart.hideTooltip();},onBrushend(e) {const view = chart.get('view');const {data} = e;view[1].filterShape(obj => {return data.indexOf(obj) > -1;});}});// 双击图表,恢复初始状态chart.on('plotdbclick', () => {chart.get('options').filters = {};chart.repaint();})}}function onReset() {chart.get('options').filters = {};chart.repaint();}const attrs = {data: dataSource,scale,height,padding,forceFit: true,onGetInstance: g2Chart => {g2Chart.animate(false);chart = g2Chart;}}return (<Chart {...attrs}><Axis name='date' label={label} /><Axis name='value' />// 隐藏竖线<Tooltip crosshairs={false}/><Legend /><Geomtype='line'position='date*value'size={2}shape='smooth'color='type'/></Chart>)
g2-brush
function init() {new Brush({canvas: chart.get('canvas'),chart,type: 'X',onBrushstart() {chart.hideTooltip()},onBrushmove() {chart.hideTooltip()},})// 双击清除过滤,恢复初始状态chart.on('plotdblclick', () => {chart.get('options').filters = {}chart.repaint()})}

若有收获,就点个赞吧
0 人点赞
