避免使用scale的formatter,会全局生效,推荐使用Geom的formatter; 文档链接
tooltip formatter数据格式化
格式化时间,推荐使用 scale: {mask: ‘YYYY-MM-DD HH:mm’}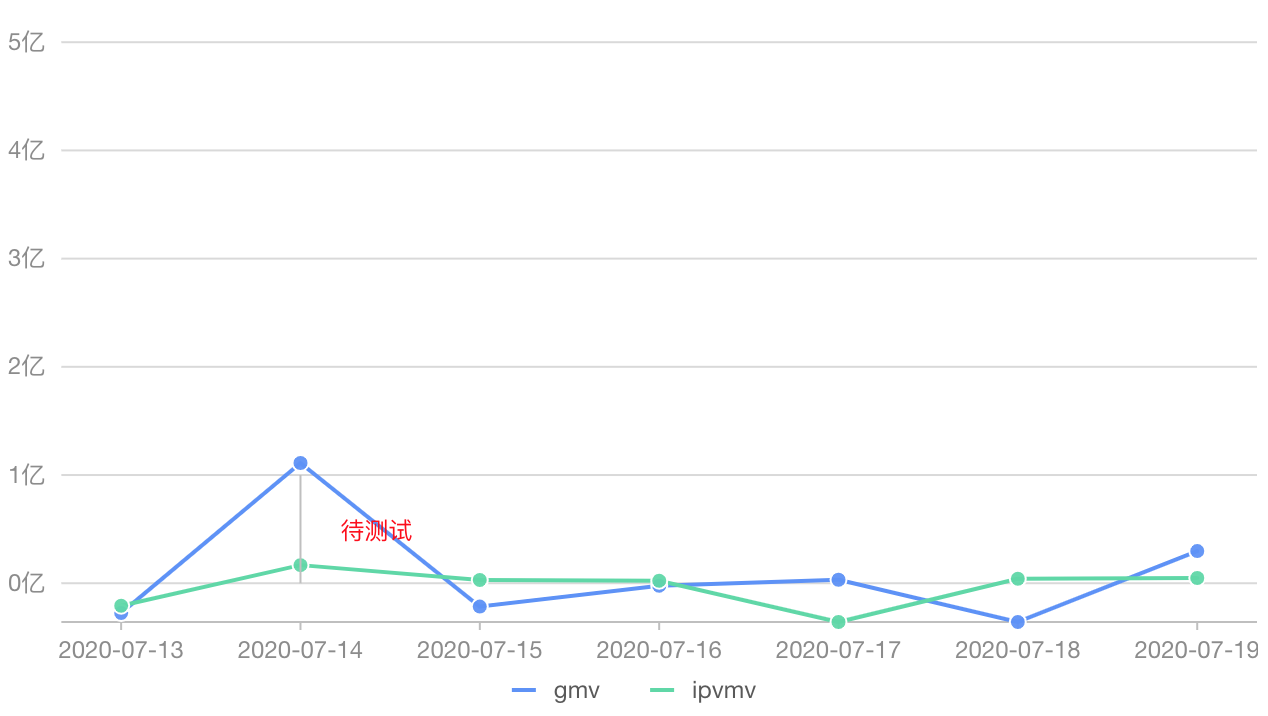
import React from 'react';import {Chart,Geom,Axis,Tooltip,Legend,Annotation,Guide} from 'bizcharts';const { Line } = Guide;class LineChart extends React.Component {render() {const data = [{"month": "2020-07-13","city": "gmv","revenue": -0.2746803819927546},{"month": "2020-07-13","city": "ipvmv","revenue": -0.20788567741539923},{"month": "2020-07-14","city": "gmv","revenue": 1.1112345769215202},{"month": "2020-07-14","city": "ipvmv","revenue": 0.16731818696980633},{"month": "2020-07-15","city": "gmv","revenue": -0.21605967007286453},{"month": "2020-07-15","city": "ipvmv","revenue": 0.030564033267740633},{"month": "2020-07-16","city": "gmv","revenue": -0.023336570083636064},{"month": "2020-07-16","city": "ipvmv","revenue": 0.0230},{"month": "2020-07-17","city": "gmv","revenue": 0.0321},{"month": "2020-07-17","city": "ipvmv","revenue": -0.3583},{"month": "2020-07-18","city": "gmv","revenue": -0.3579},{"month": "2020-07-18","city": "ipvmv","revenue": 0.0416},{"month": "2020-07-19","city": "gmv","revenue": 0.2969},{"month": "2020-07-19","city": "ipvmv","revenue": 0.0486}];const scale = {"revenue": {"range": [0,1],"ticks": [0,1,2,3,4,5,6]},"month": {"range":[0.05, 0.95]}};const guide = {"type": "line","start": {"month": "2020-07-14","revenue": "0"},"end": {"month": "2020-07-14","revenue": "1"},"lineStyle": {"stroke": "#999","lineDash": [0,1,1],"lineWidth": 1},"text": {"position": "start","autoRotate": true,"style": {"fill": "red"},"offsetX": 20,"offsetY": -20,"content": "待测试"}};return (<Chart height={400} data={data} scale={scale} autoFit><Legend /><Axis name="month" /><Axisname="revenue"label={{formatter: val => `${val}亿`,}}/><TooltipshowCrosshairsshared/><Geom type="line" tooltip={['revenue*city', (value, name) => {return {value: `${value.toFixed(3)} 亿`,name}}]} position="month*revenue" size={2} color={'city'} /><Geomtype="point"tooltip={false}position="month*revenue"size={4}shape={'circle'}color={'city'}style={{stroke: '#fff',lineWidth: 1,}}/><Guide><Linestart={{"month": "2020-07-14","revenue": "0"}}end={{"month": "2020-07-14","revenue": "1"}}lineStyle={{"stroke": "#999","lineDash": [0,1,1],"lineWidth": 1}}text={{"position": "start","autoRotate": false,"style": {"fill": "red"},"offsetX": 20,"offsetY": -20,"content": "待测试"}}/></Guide><Annotation.Textposition={['50%', '50%']}alignX="middle"alignY="middle"html={`<div style="color:#8c8c8c;font-size:1.16em;text-align: center;width: 10em;">项目总数<br><span style="color:red;font-size:2.5em;">${200}</span></div>`}/></Chart>);}}export default LineChart

若有收获,就点个赞吧
0 人点赞
